


Last updated on
Time has come for a new issue of our regular review of the loan portfolio with the usual indicators.
What’s new on this one is that we include an additional dimension for the yearly returns and the profit. We call them adjusted returns and adjusted profit.
Why?
The last debt sale occurred 1 year ago and since then a few loans have reached more than 120 days delay without recent payment to keep them under management much longer. We did not sell them so far, first because of the limitations from the emergency state situation, and second because their number is still too small, and the market conditions are not very favourable to get a decent selling price.
This situation may continue for some months. Of course, we keep doing our best to collect these loans. However, we decided to also calculate the main KPIs as if we had been able to sell them.
How?
We take 80% of the outstanding of the loans with more than 5 installments in delay. This amount constitutes a provision which is used to adjust downwards the return and the profit. In other words, we simulate the return and the profit as if we had been able to sell these loans at 80% discount, a rather conservative approach.
1. Average return on the whole portfolio
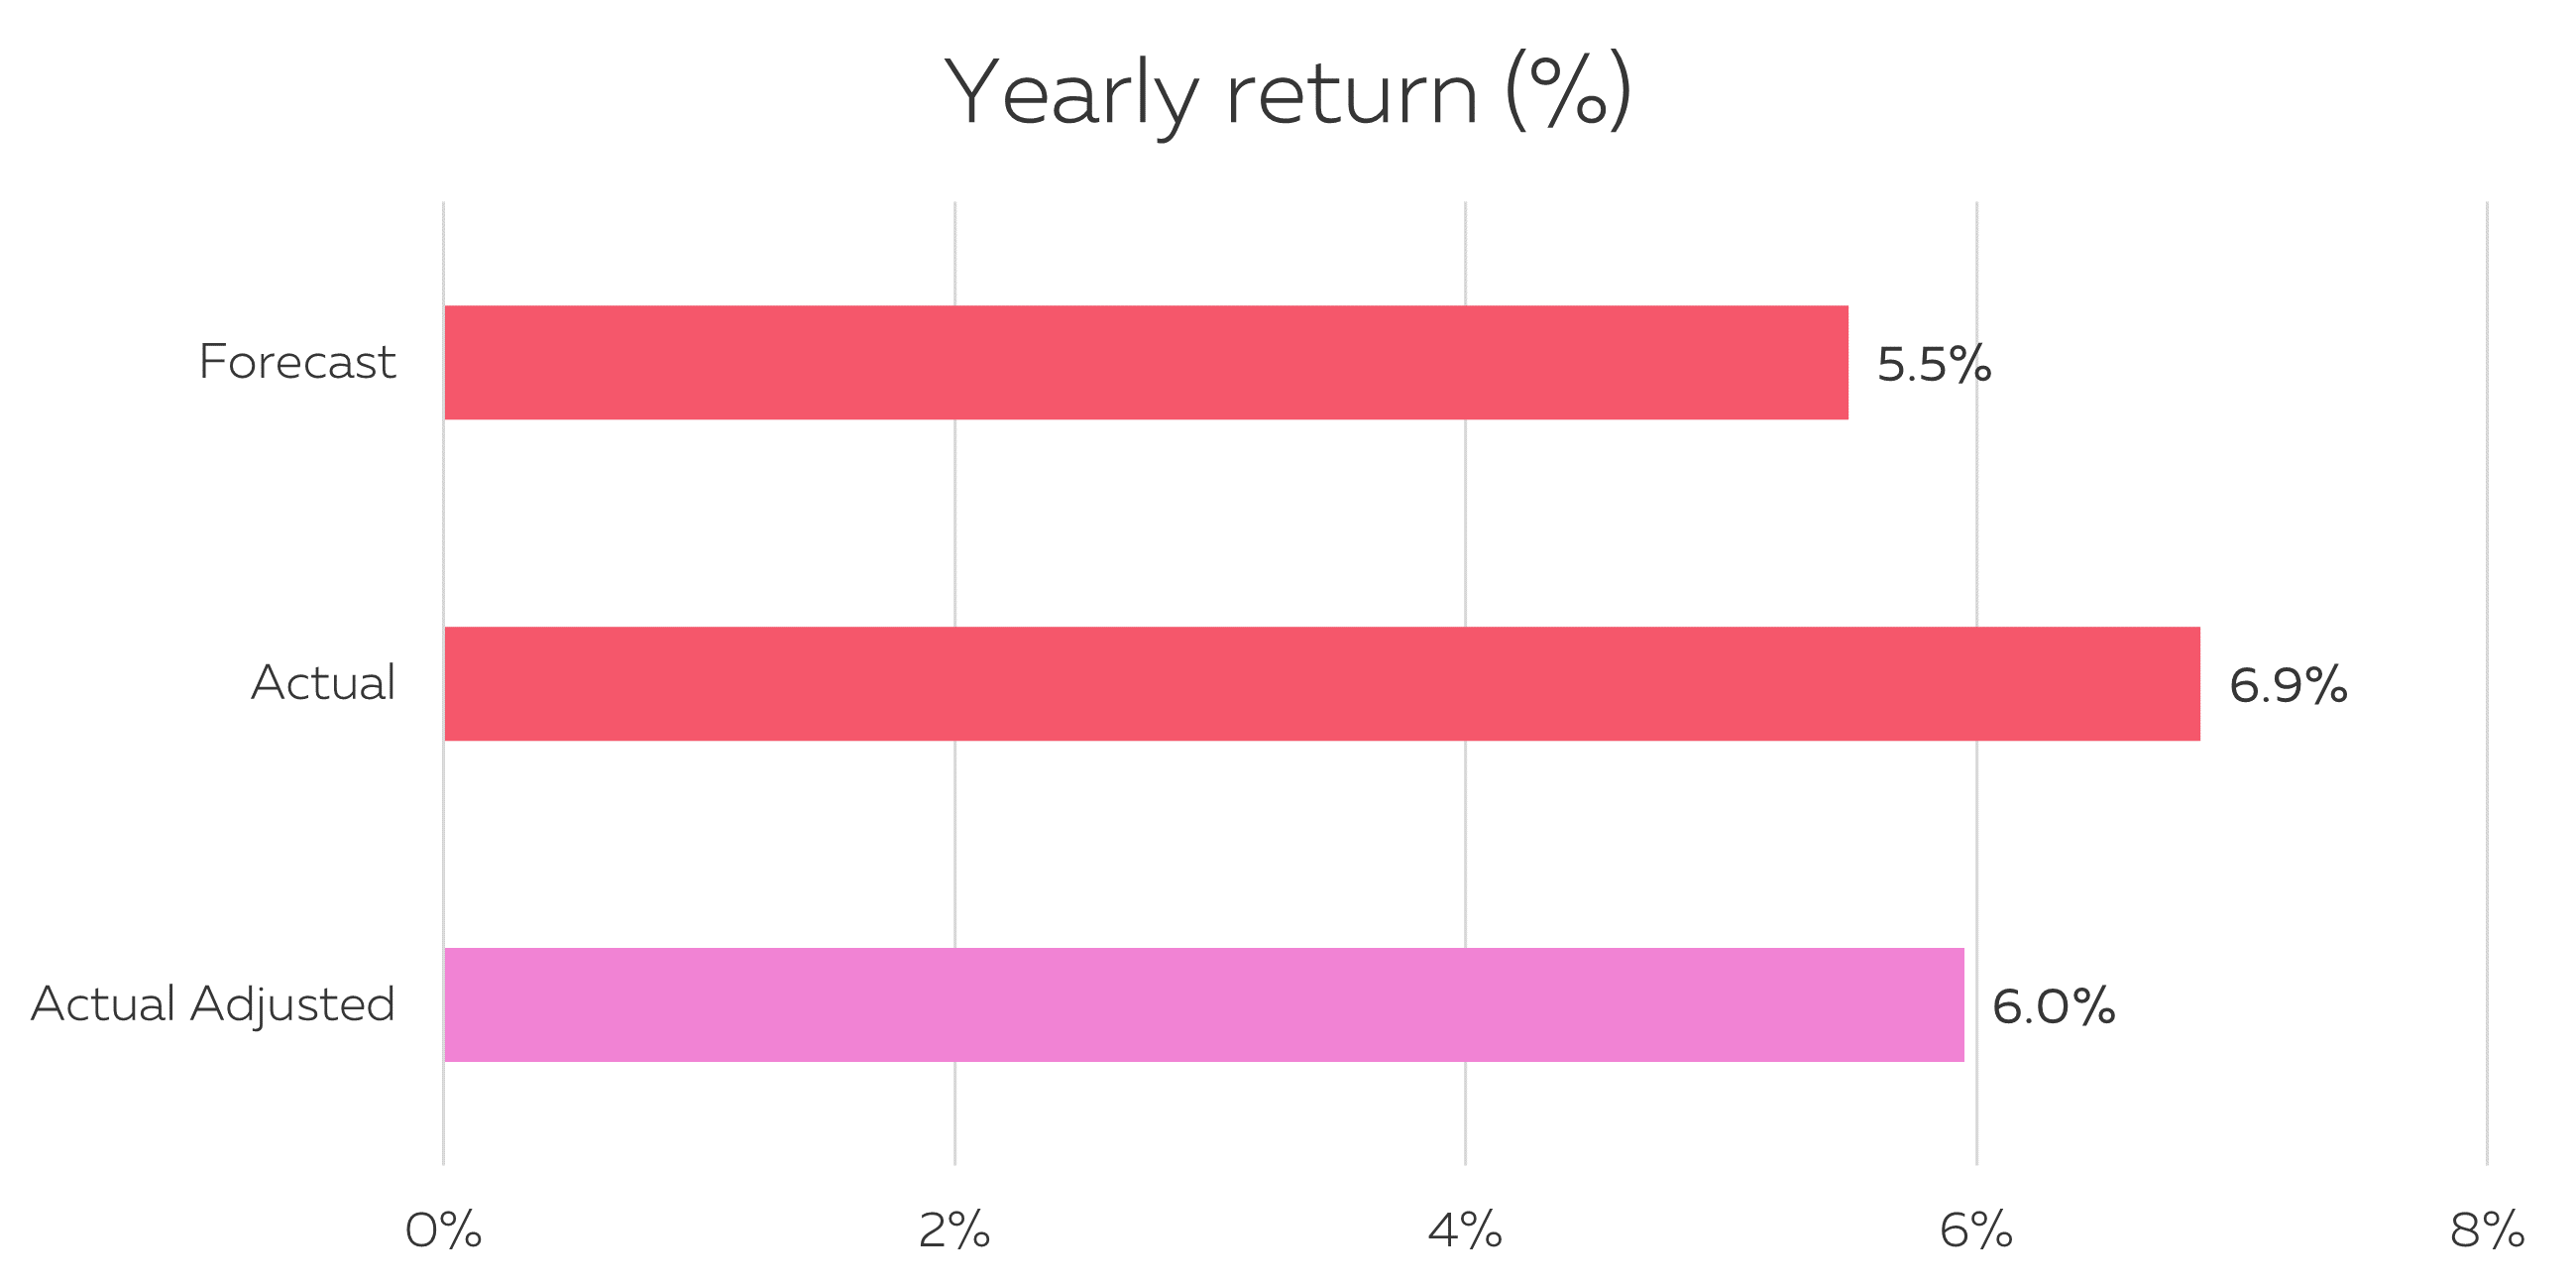
The portfolio continues to behave better than initially forecasted. Even after the adjustment explained in the introduction, the average return is 6%, above the forecasted 5.5%.
2. Net profit
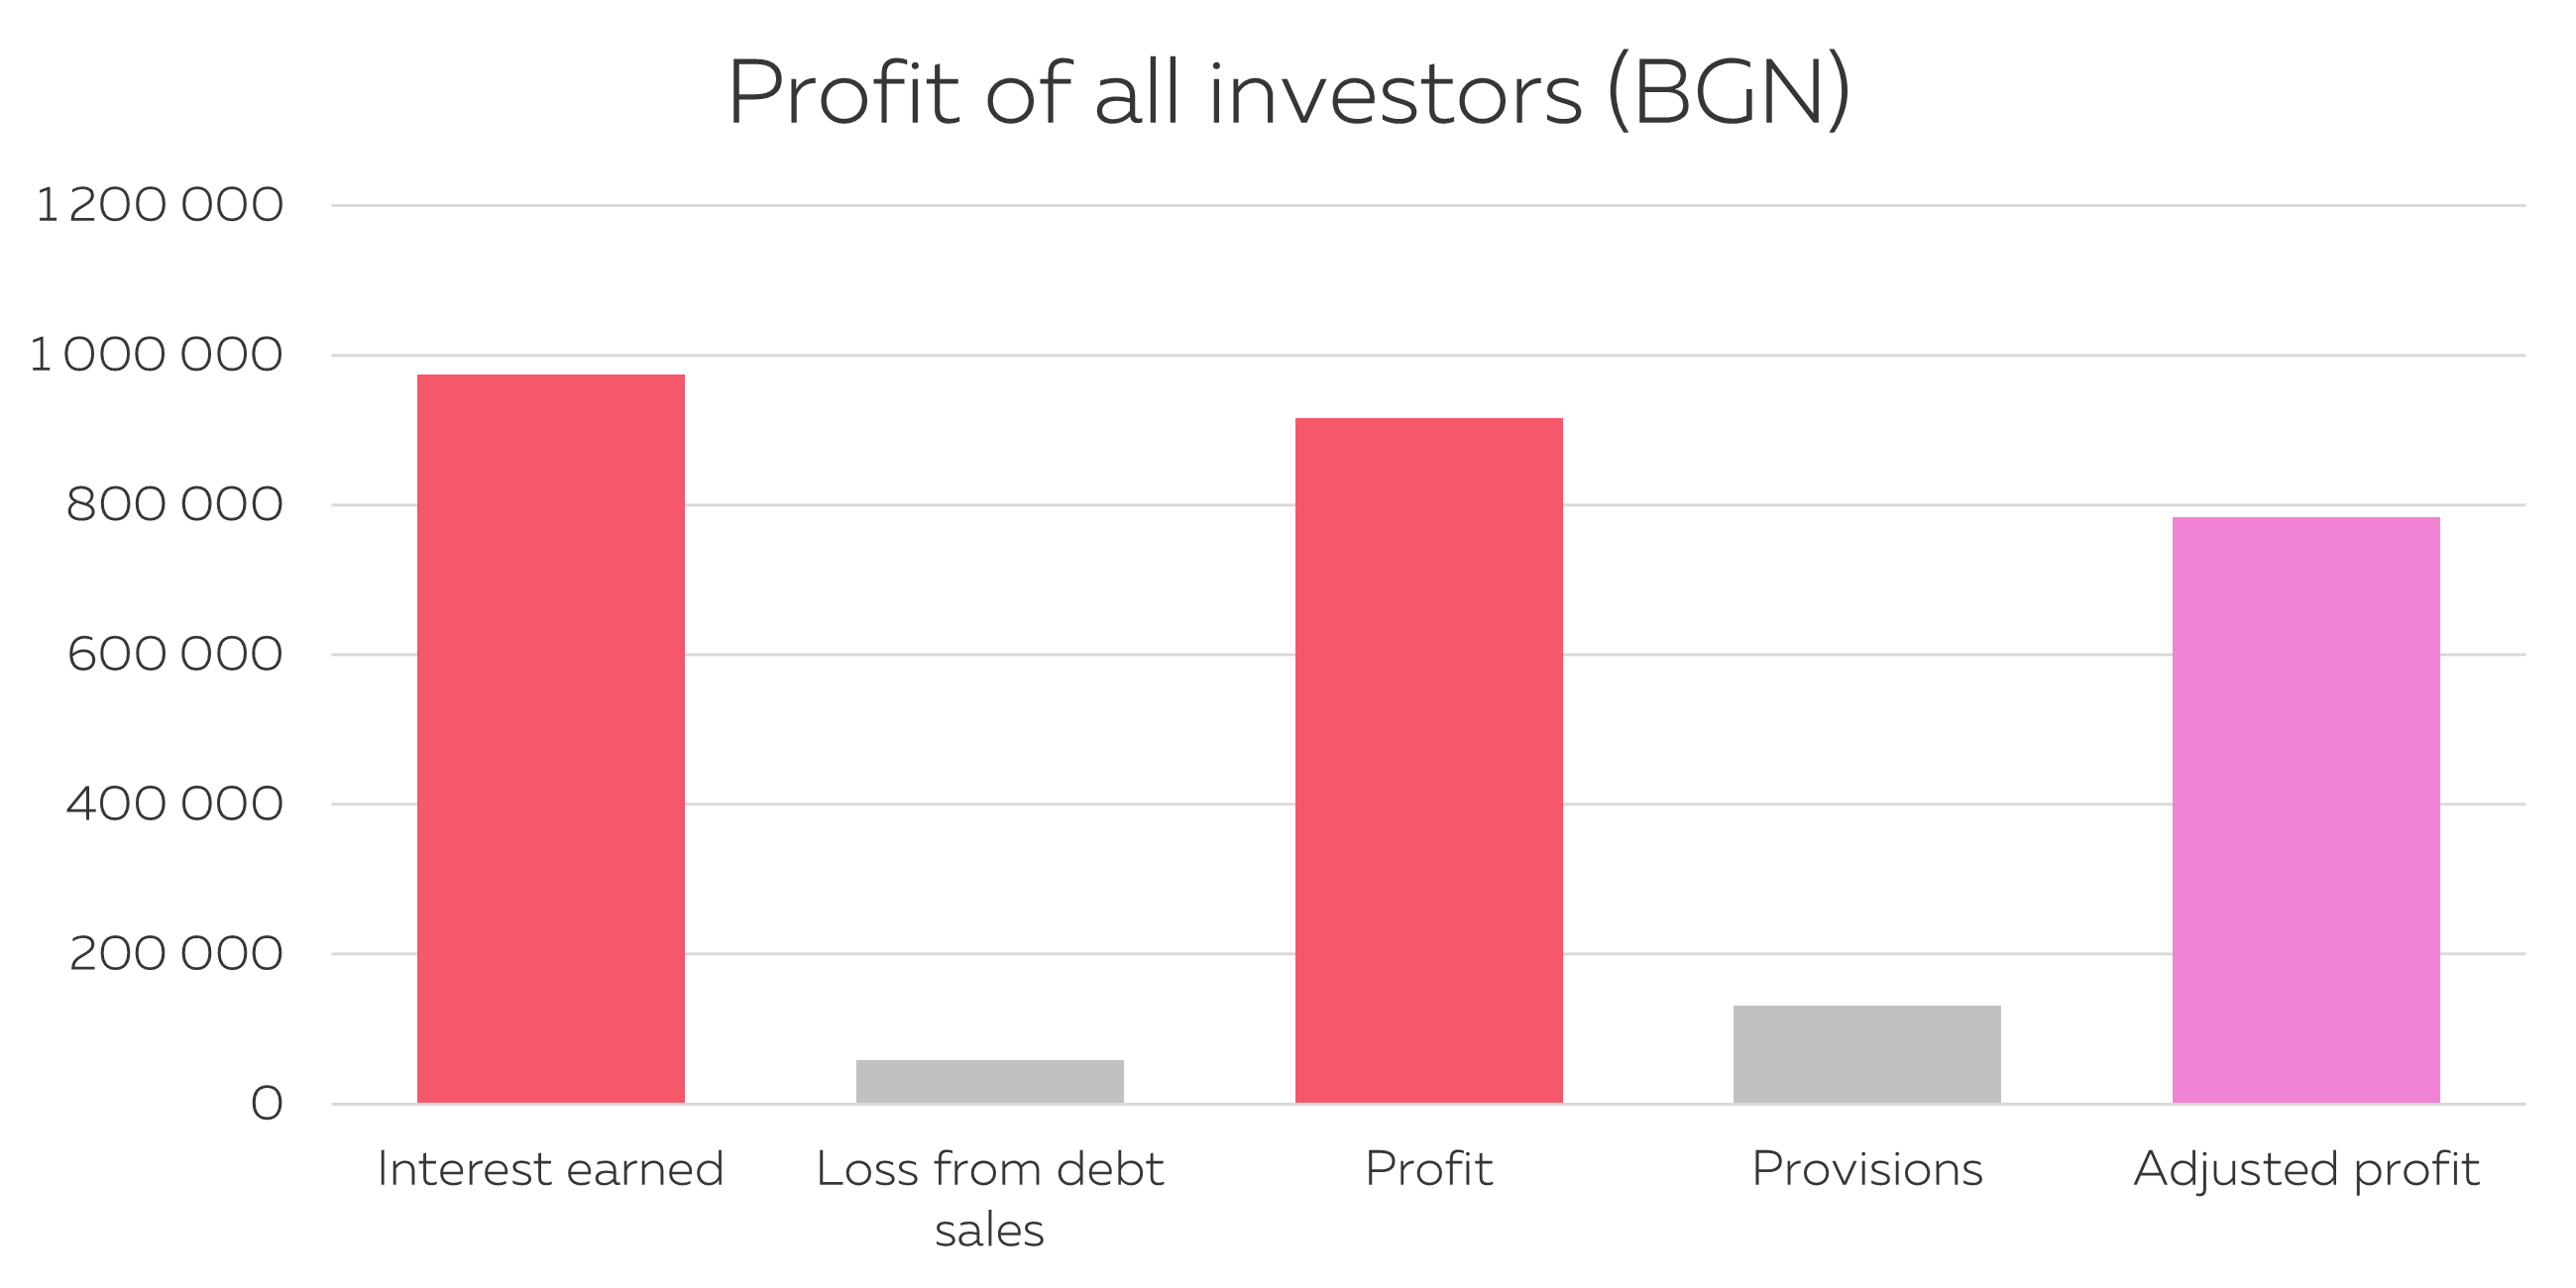
This graph shows that our P2P model is very robust. The amount of interest earned is much higher than the losses coming from the sale of bad loans. The adjustment coming from the provisions on the soon-to-be sold bad loans does not change the conclusion that there is a large buffer to ensure a sustainable profit even during tough economic times.
3. Investors by level of return
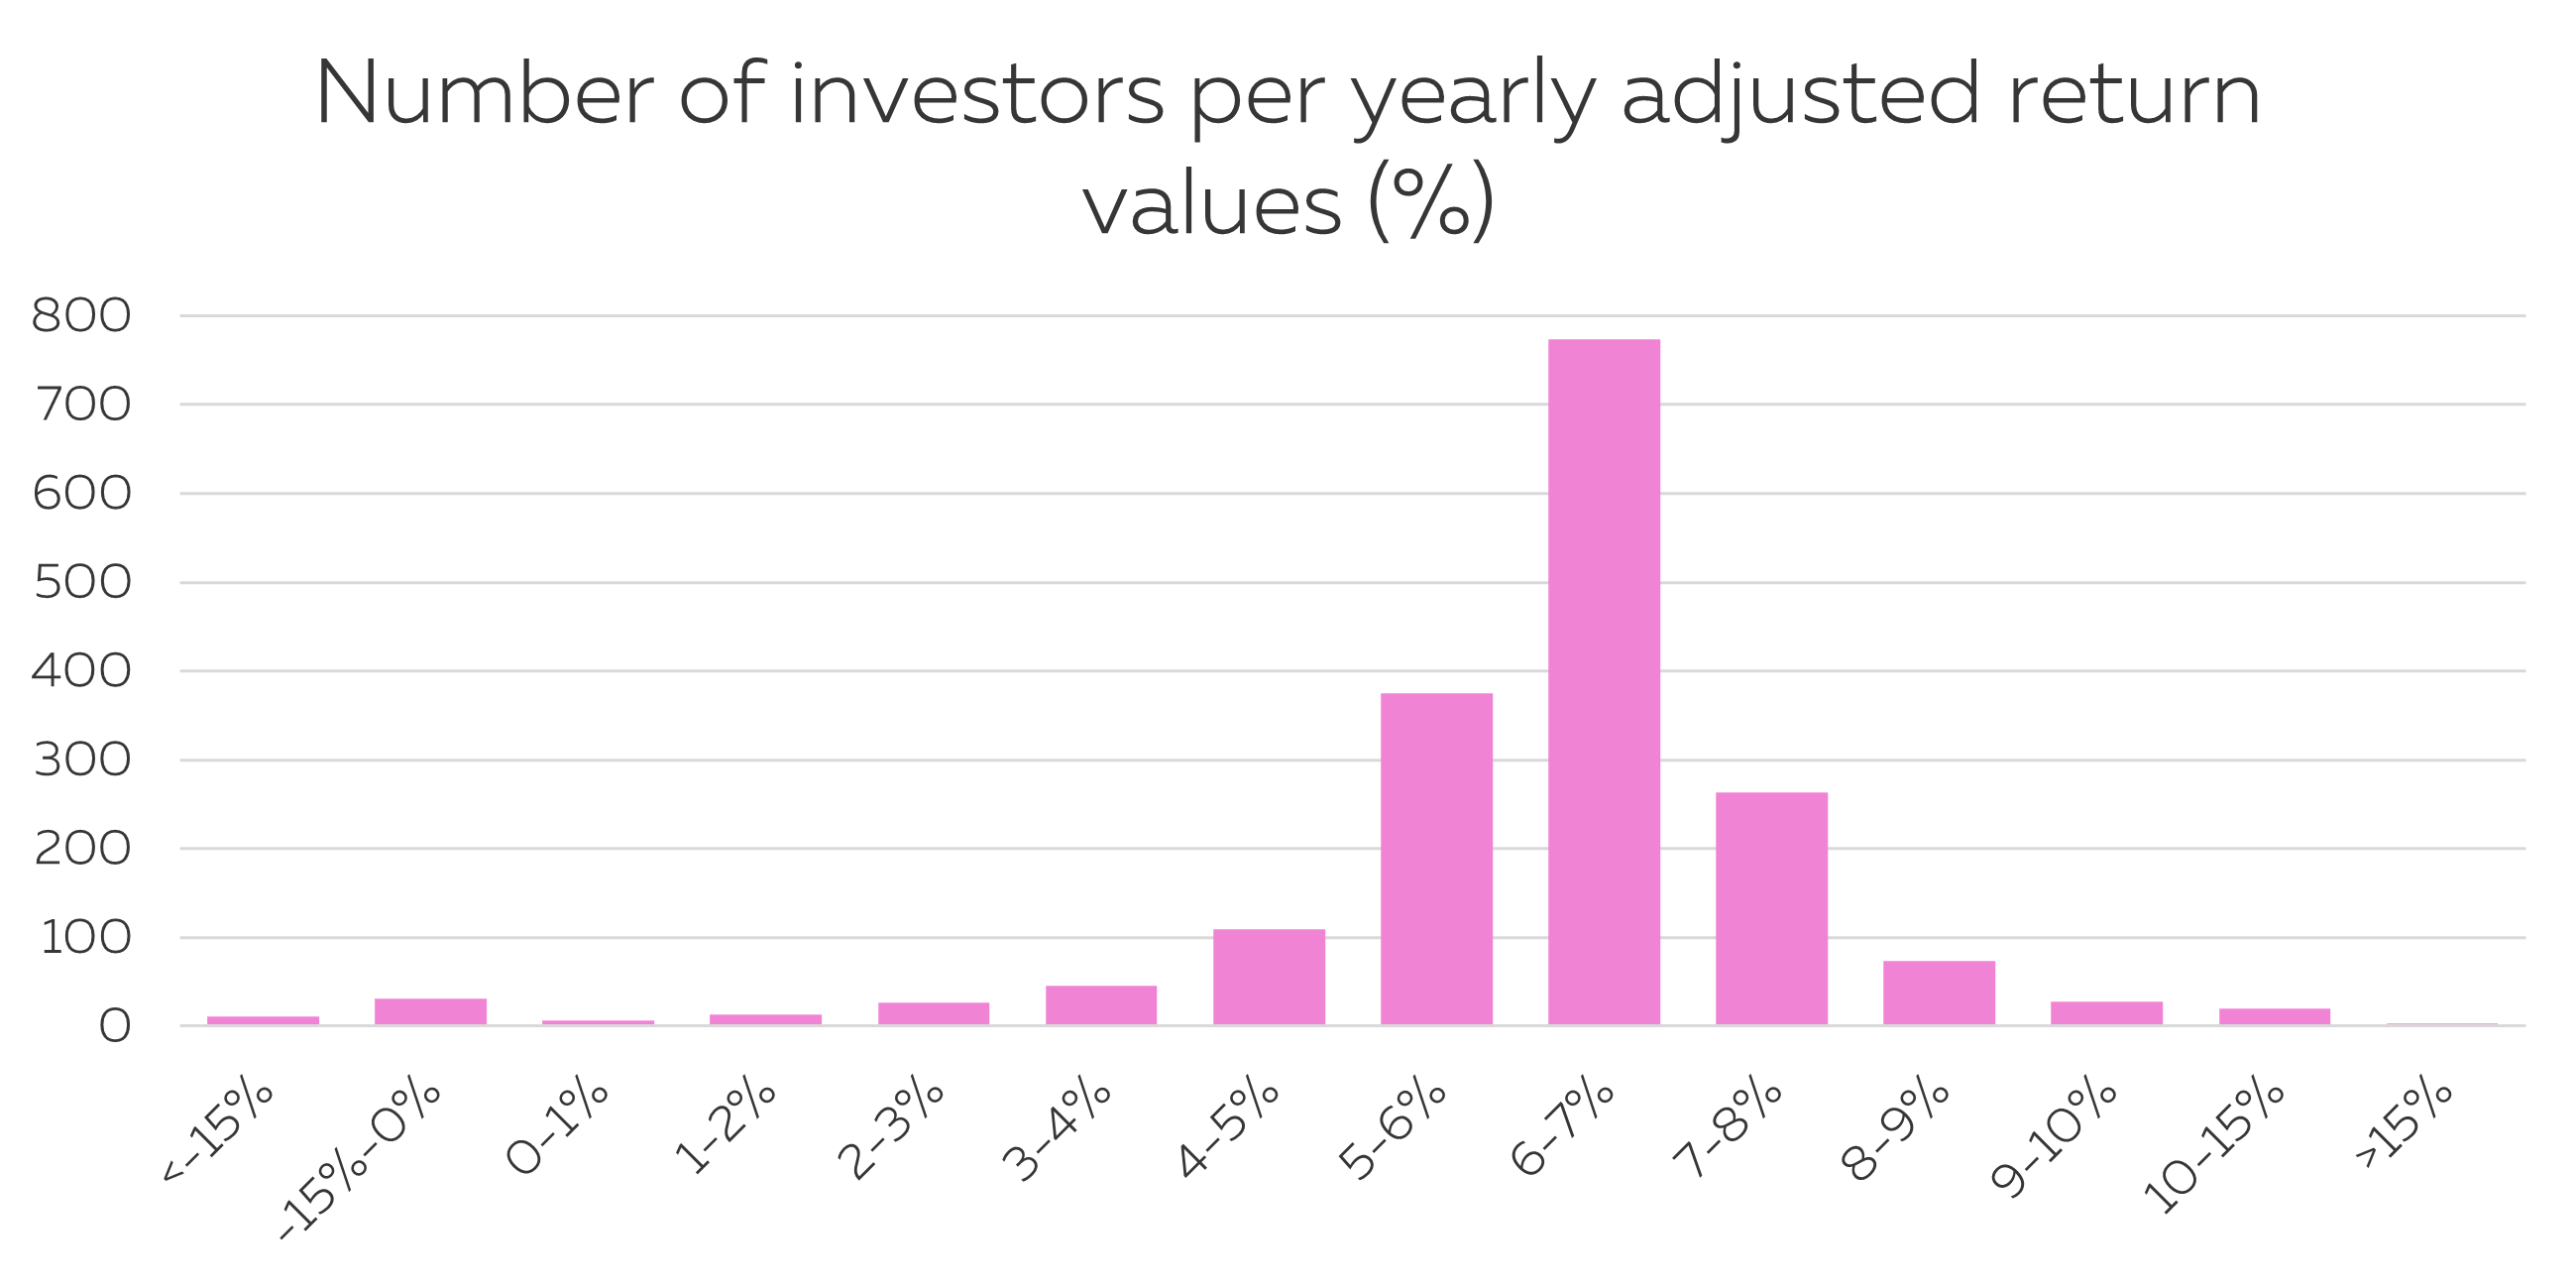
Adjusted returns are mostly ranging between 5% and 8%.
4. Adjusted returns vs number of loans invested in (for investors not actively trading on the secondary market)
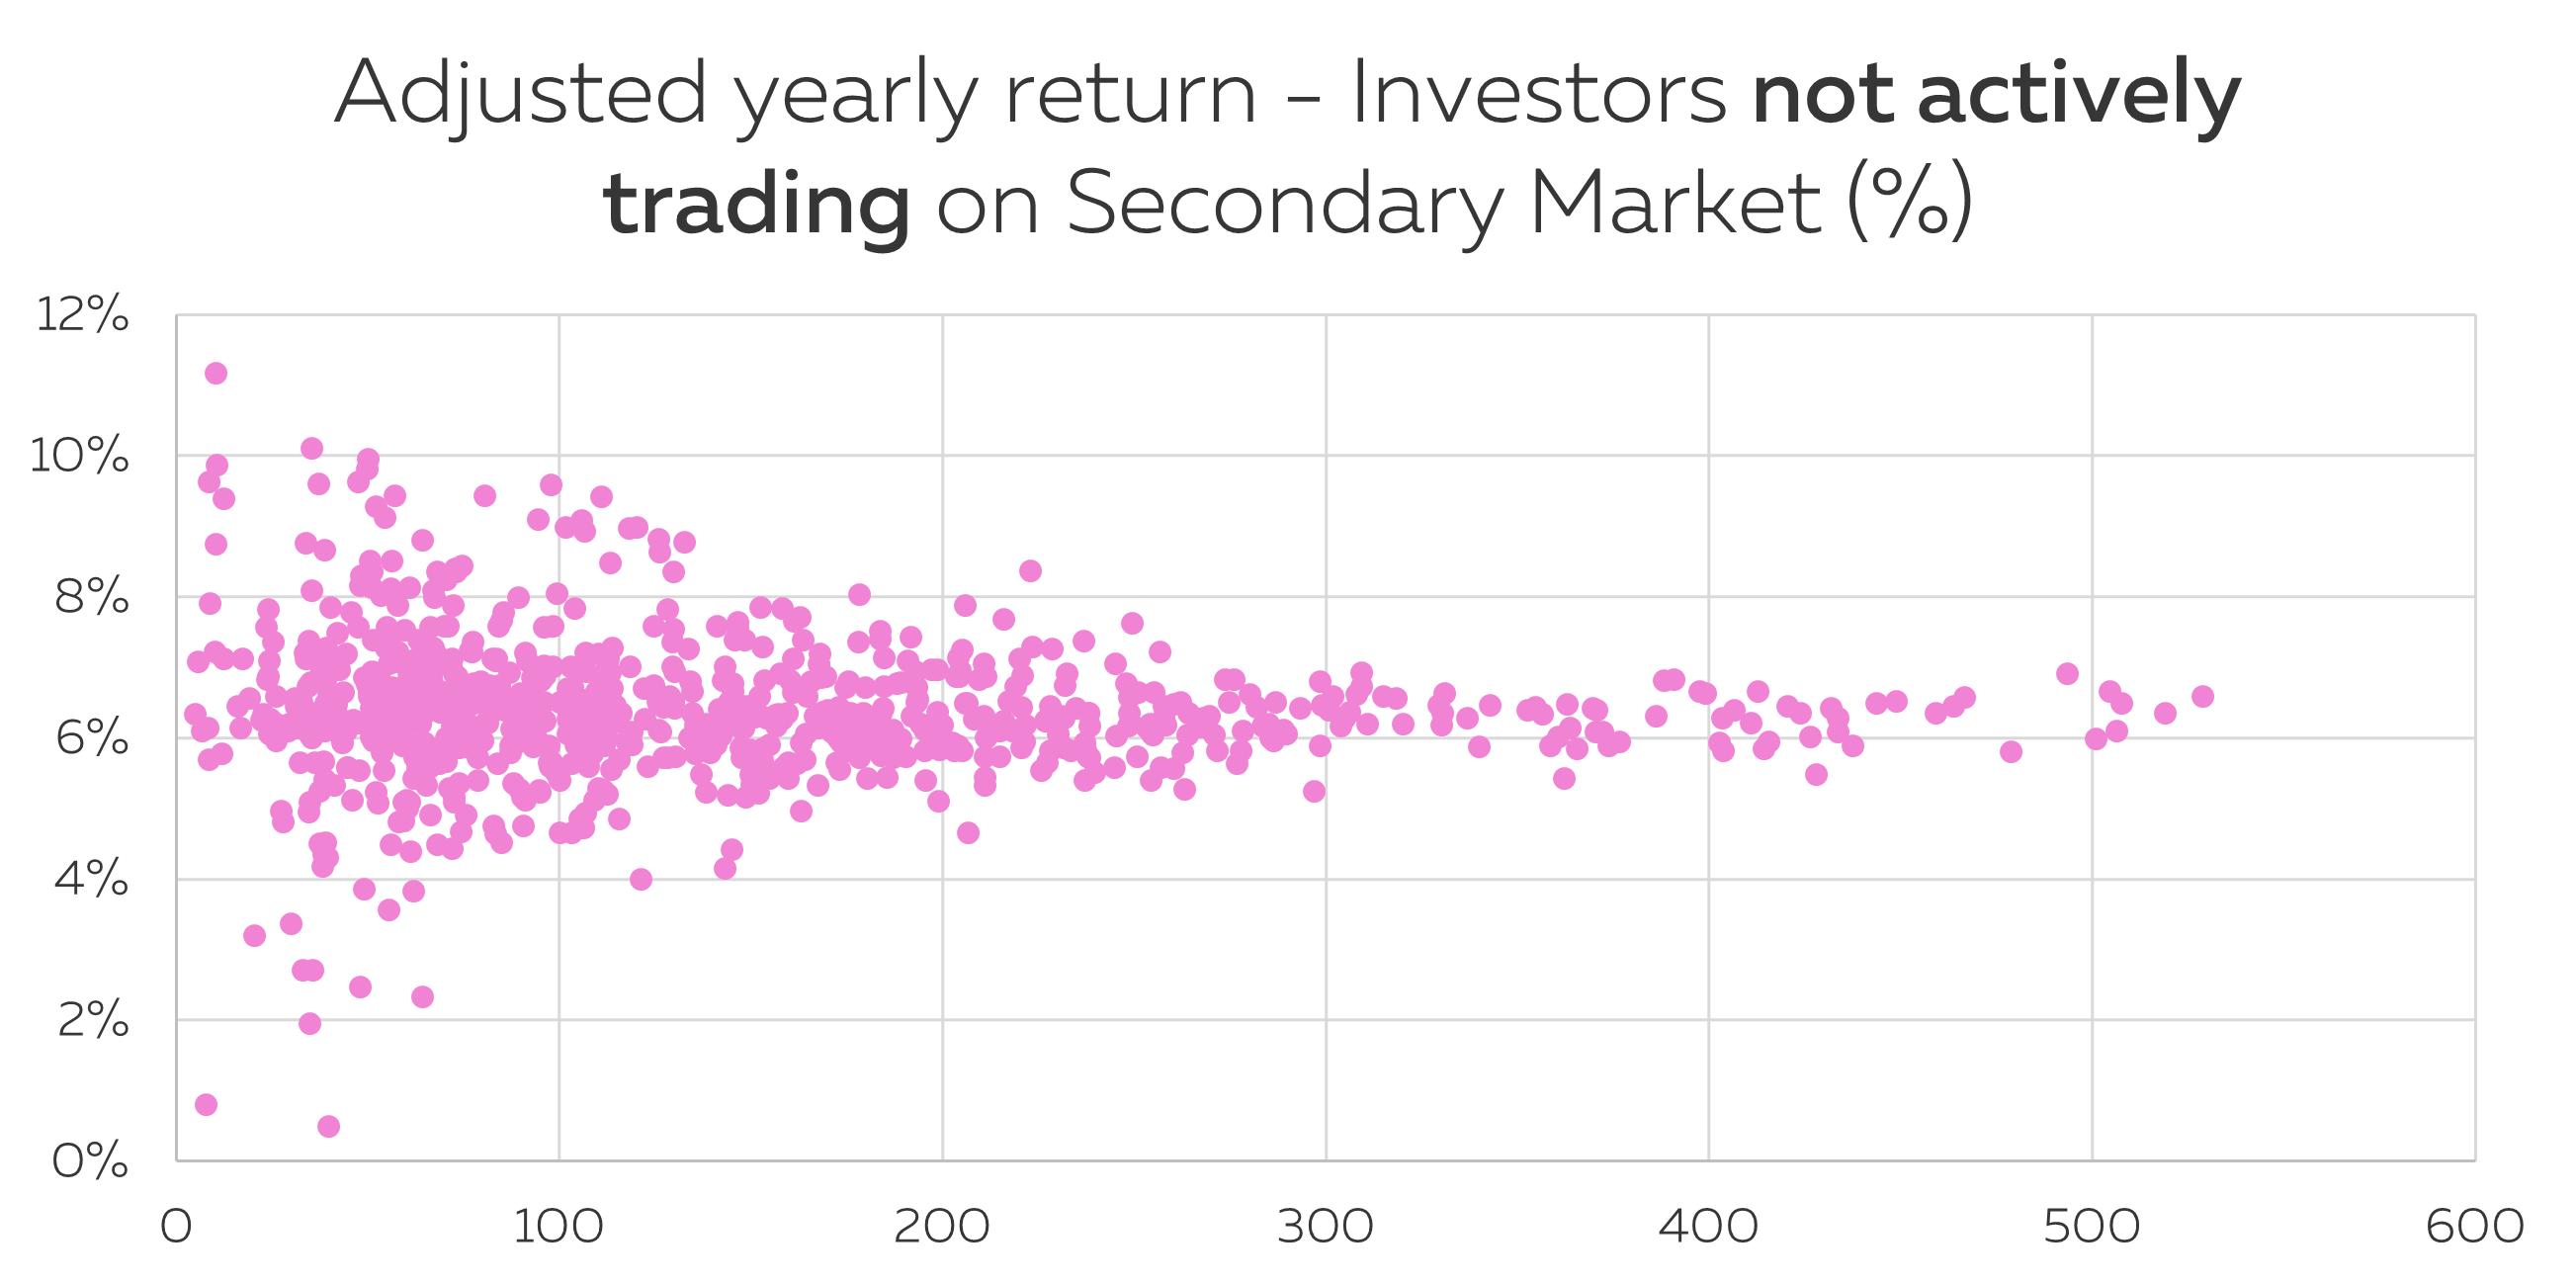
To consider if an investor is actively trading on the secondary market, we look at its purchases and sales on the secondary market, more precisely if he’s buying or selling at a discount/premium quite different from the recommended KIP. If the difference between actual and recommended price represents more than 5% of the earned interest, he is classified as actively trading on the secondary market.
Besides, we count only investors who have earned at least 1 BGN of interest.
All the investors with more than 150 loans (the safe threshold) have an adjusted return above 5%.
5. Adjusted return vs number of loans invested in (for investors actively trading on the secondary market)
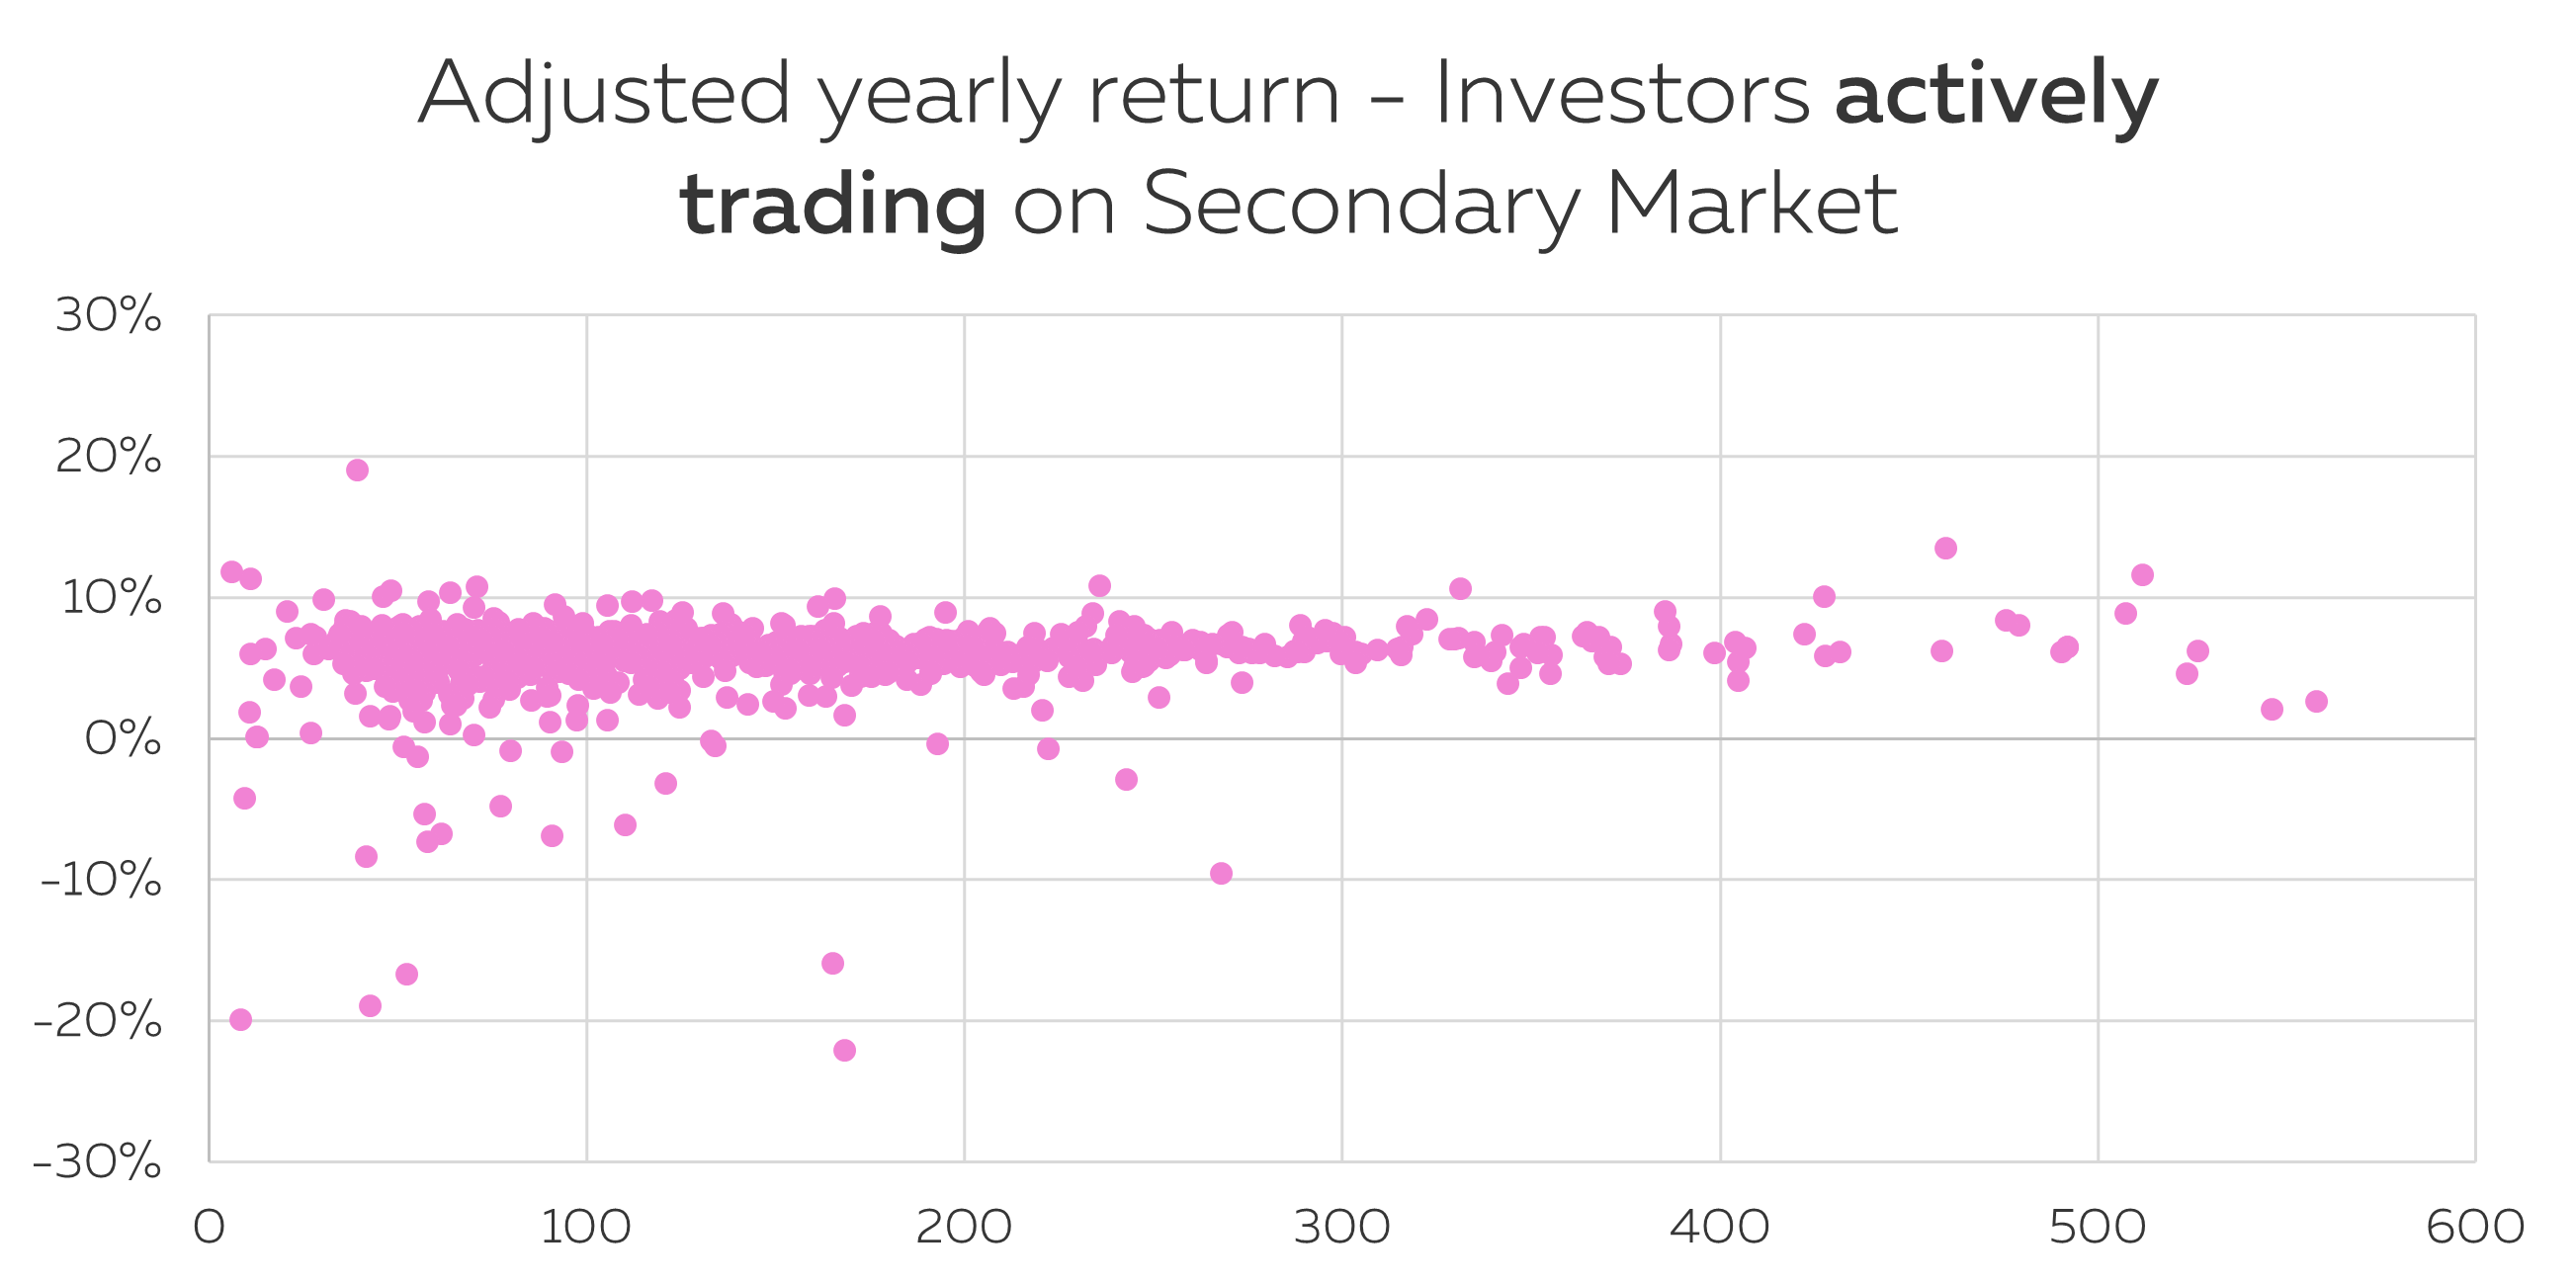
Transacting on the secondary market offers opportunities to earn above 10% but it is riskier.
6. Time to sell
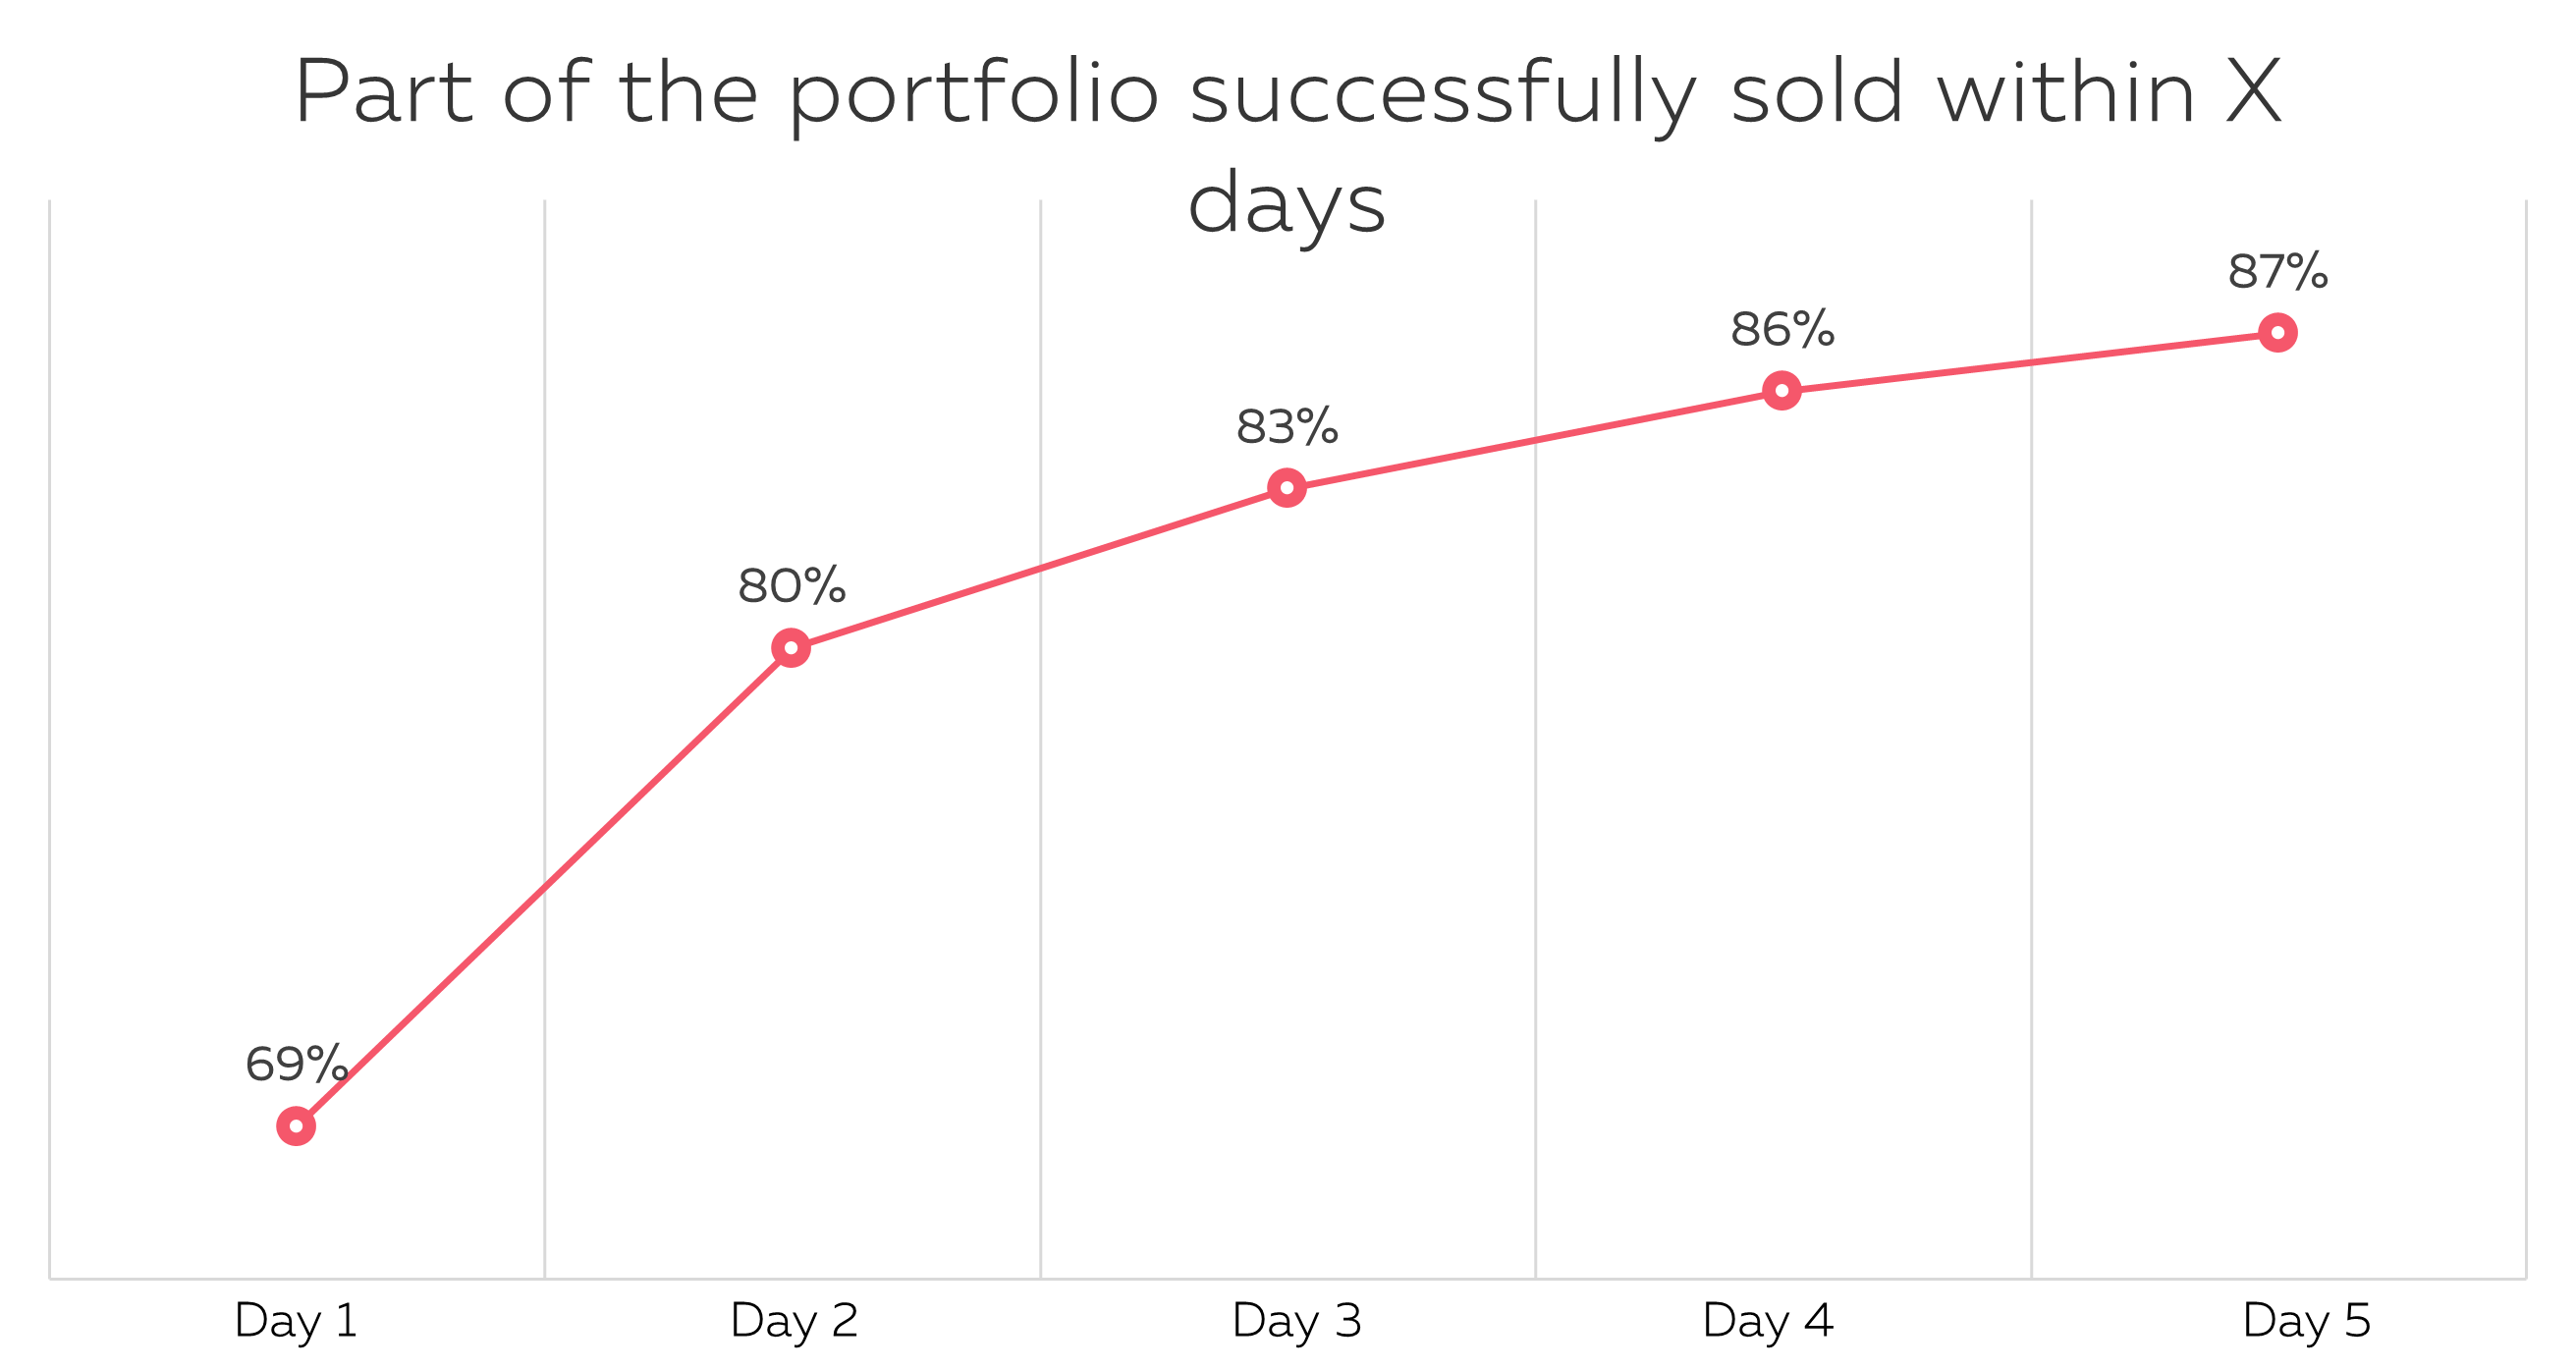
The average time to sell has slightly increased since the last report. This is because we had an increase in listings for sale at the beginning of the lockdown mid-March. This created a temporary backlog which was cleared by the end of May. The time to sell is now back to the previous levels.
7. Risk levels by vintage of production
Short term indicator R2-6
It’s a short-term indicator to assess at an early stage the quality of a new vintage.
We look at loans financed having reached more than 30 days delay in the first 6 months of their life (among all loans from a vintage which had at least 6 months of life)*.
| Period | Financed* | Incidents | R2-6 % |
|---|---|---|---|
| 2016 S2 | 77 | 3 | 3.9% |
| 2017 S1 | 168 | 3 | 1.8% |
| 2017 S2 | 173 | 4 | 2.3% |
| 2018 S1 | 183 | 0 | 0.0% |
| 2018 S2 | 188 | 1 | 0.5% |
| 2019 S1 | 213 | 5 | 2.3% |
| 2019 S2 | 259 | 4 | 1.5% |
| 2020 S1 | 136 | 2 | 1.5% |
| ALL | 1 397 | 22 | 1.6% |
According to this early risk indicator, the loans originated in the second semester of 2019 and in the first semester of 2020 are of average quality. No alert.
How to read it:
For example, among all the loans financed in the first semester of 2020, 136 had at least 6 months of history and among them 2 reached at least 30 days delay (equivalent to 2 installments in delay), which is 1.5%. Please note that these 2 loans may have repaid their delay since.
1 Year risk indicator R3-12
We look at loans having reached more than 60 days delay (equivalent to 3 installments in delay) in the first 12 months of their life, among all loans from a vintage which had at least 12 months of life.
| Period | Financed* | Incidents | R3-12 % |
|---|---|---|---|
| 2016 S2 | 77 | 3 | 3.9% |
| 2017 S1 | 168 | 6 | 3.6% |
| 2017 S2 | 173 | 9 | 5.2% |
| 2018 S1 | 183 | 3 | 1.6% |
| 2018 S2 | 188 | 2 | 1.1% |
| 2019 S1 | 213 | 5 | 2.3% |
| 2019 S2 | 185 | 5 | 2.7% |
| ALL | 1 187 | 33 | 2.8% |
We have the confirmation that 2018 provided the loans with the best quality and that 2019 is on the average. Once again, no alert.
Conclusion
The most recent numbers are on the average, which is a very positive insight considering the context we all live in since March 2020.
 How did P2P lending fare during COVID-19?
 Is P2P lending providing better conditions than banks?
 4 most frequently asked questions by our investors
 Klear 5 years and 20 milestones