


Last updated on
After the first quarter of 2019, we decided to update and present the current assessment of the loan portfolio.
Most of the graphs are with a short comment, when it's necessary, as the result and conclusion are very close to the previous article released 6 months ago.
We are going to review with more details new indicators about the loan portfolio: the risk levels of the production, which you can find at the end of the article.
1. Average return on the whole portfolio
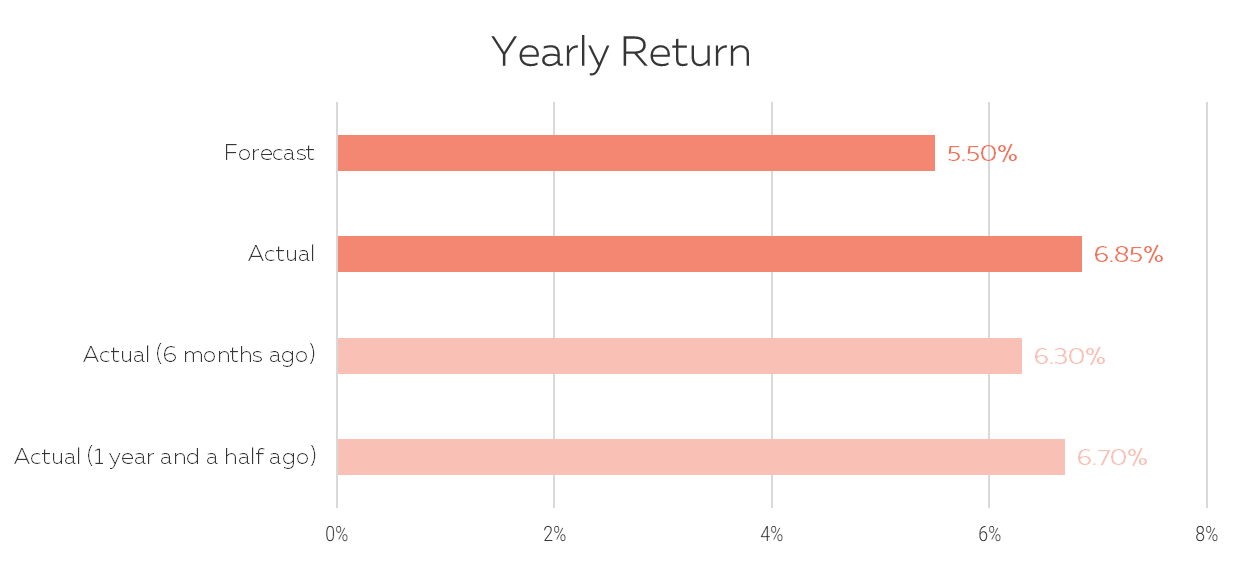
The annualized return on the whole portfolio since the launch is 6.85%, which is still above the forecast and even above the previous two times when we were assessing the performance.
Again, this is very good news, showing that the quality of the portfolio remains strong.
Still, it’s important to be noted that probably soon there will be the next debt sale as there are a few credits ready to be sold, which will slightly decrease the return.
2. Net profit on the whole portfolio
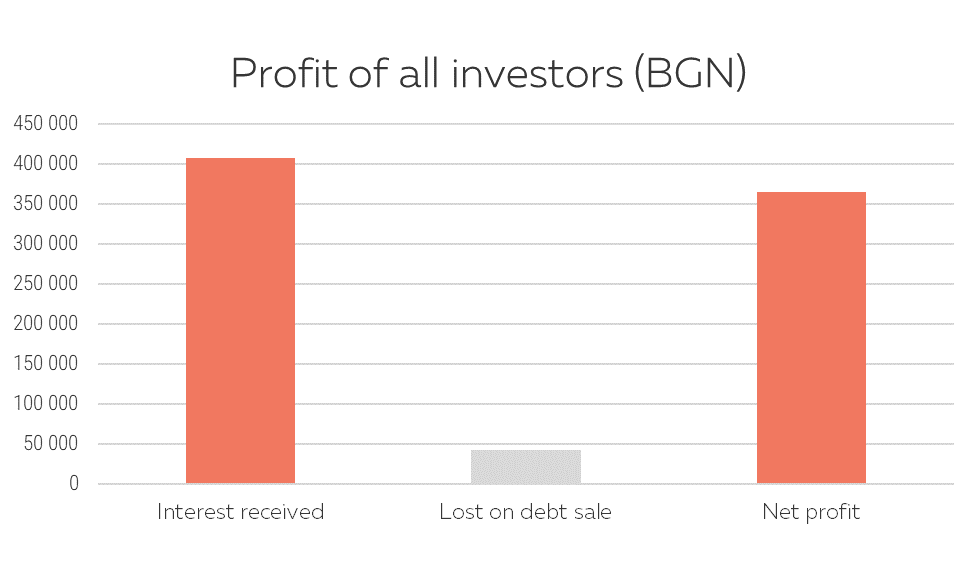
The generated profit from the whole portfolio is above 400 K BGN. There is no change in the loss from bad loans as the next debt sale has not yet been closed. For the last 6 months, the total received interest has increased by 150 K BGN.
3. Investors by level of return
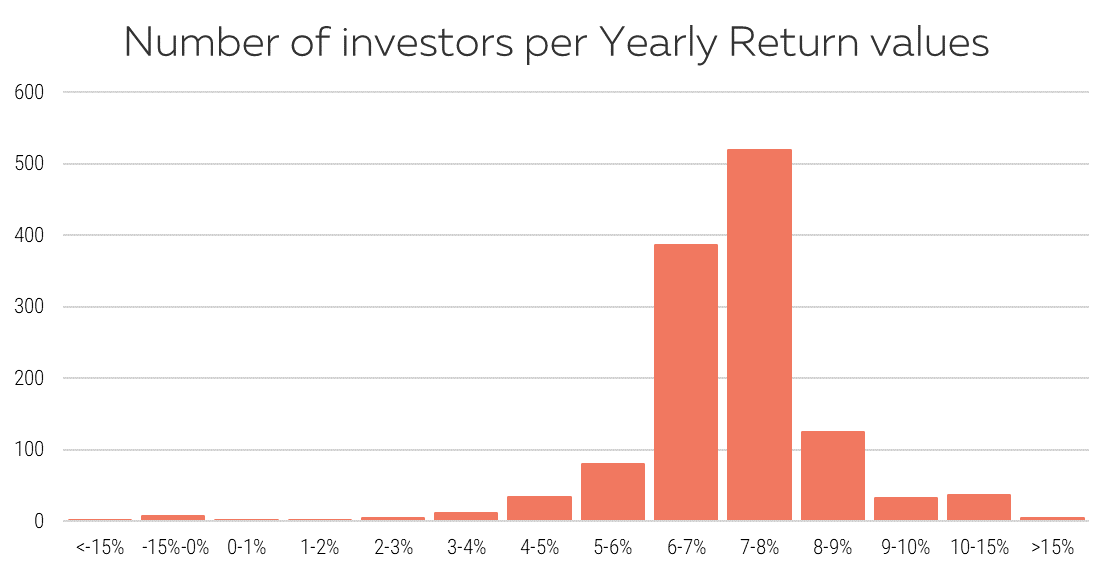
The distribution is very similar to the previous snapshot.
4. Return vs number of loans invested in (for investors not active on the secondary market)
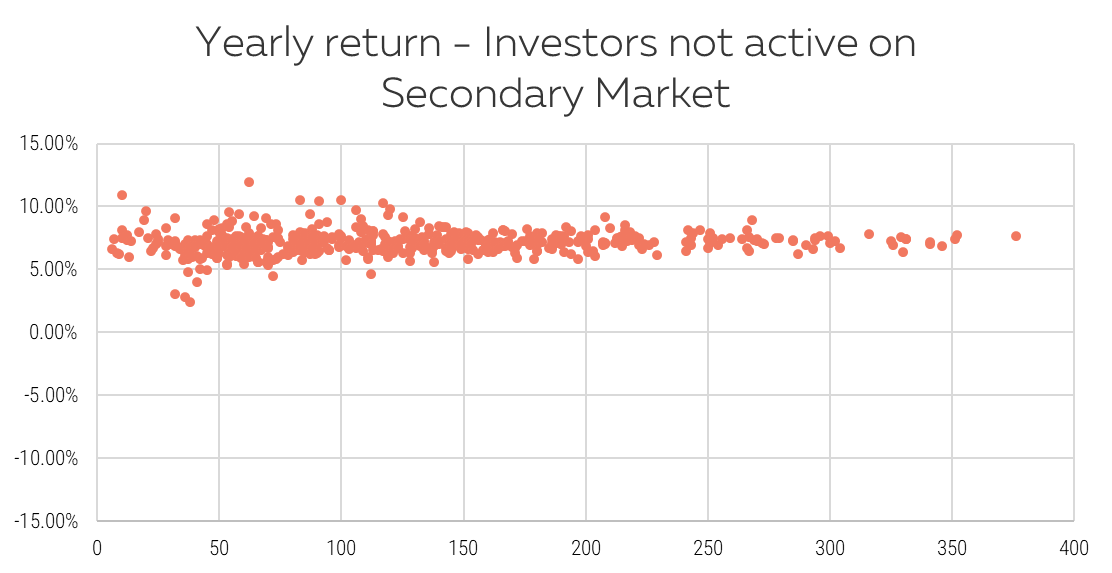
Investing only on the primary market and in as many loans as possible is the key to limit the variability of your return.
NB: You can find here more information about the calculation.
5. Return vs number of loans invested in (for investors active on the secondary market)
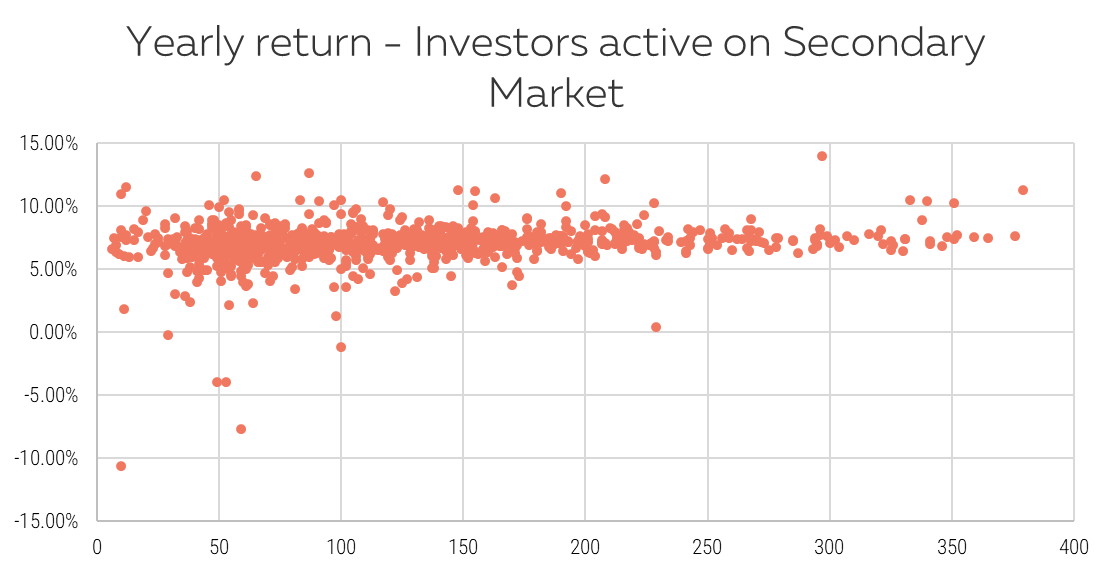
Unsurprisingly, the returns are more volatile when transacting on the secondary market.
6. Time to sell
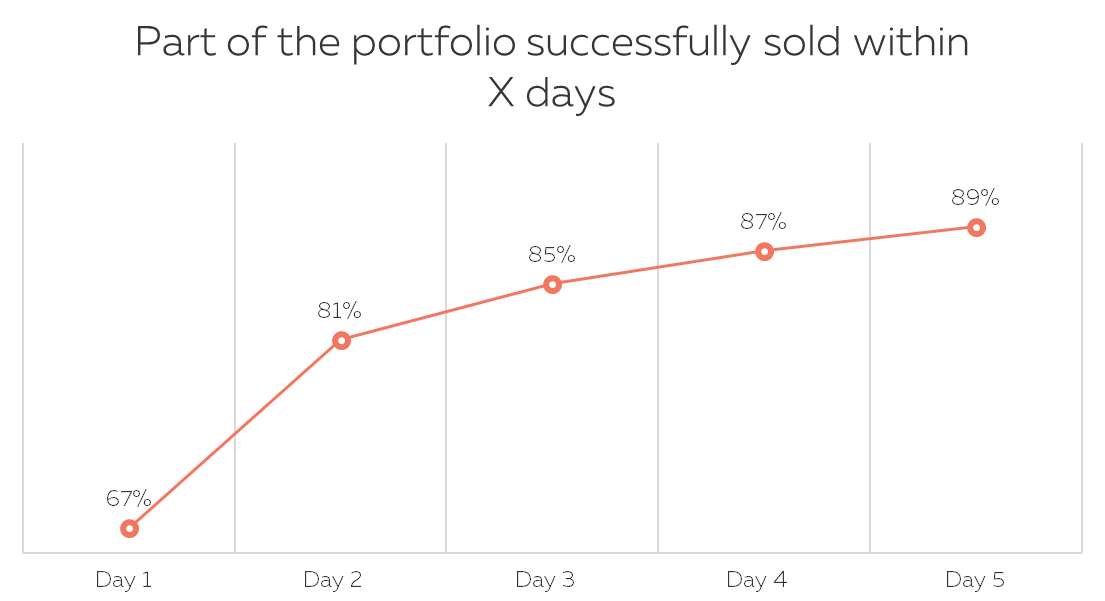
There is almost no change compared to the same statistics calculated approximatively 6 months ago.
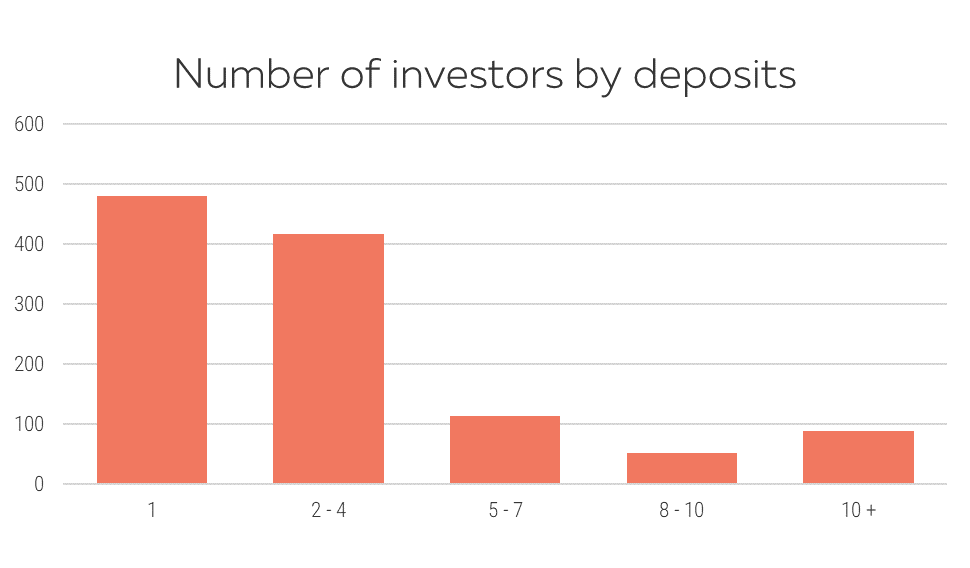
7. Investors by number of top-ups
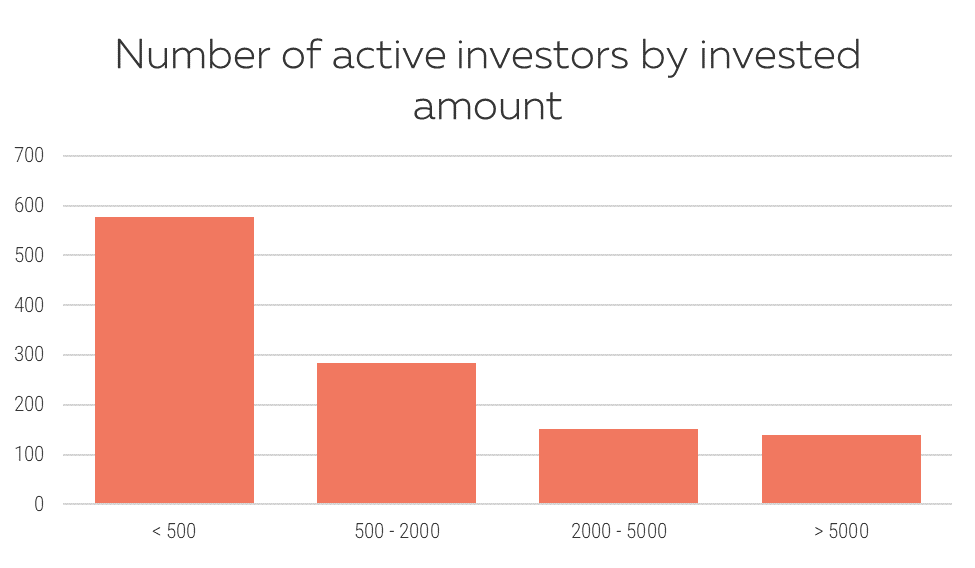
8. Investors by amount invested
9. Risk levels by vintage of production
As we have now financed close to 1 000 loans over 2 years and a half, we can start looking at payment incidents by vintage of financed loans.
Among dozens of potential KPIs, we’ve selected 2 we believe are more adequate with our volumes and history.
Please note that their main goal is to assess on a regular basis the quality of the new loans compared to previous generations.
Let’s look at the R2-6 first!
It’s a short-term indicator to assess at an early stage the quality of a new vintage.
We look at loans financed having reached more than 30 days delay in the first 6 months of their life (among all loans from a vintage which had at least 6 months of life)*.
| Period | Financed* | Incidents | R2-6 % |
|---|---|---|---|
| 2016 S2 | 77 | 3 | 3.9% |
| 2017 S1 | 168 | 3 | 1.8% |
| 2017 S2 | 173 | 4 | 2.3% |
| 2018 S1 | 183 | 0 | 0.0% |
| 2018 S2 | 115 | 1 | 0.9% |
| ALL | 716 | 11 | 1.5% |
For example, among all the loans financed in the first semester of 2017, 168 had at least 6 months of history (all indeed) and among them 3 reached at least 30 days delay (equivalent to 2 installments in delay), which is 1.8%. Please note that among these 3, some may have repaid their delay since.
Then we can compare with the loans financed in S2 2018 which lived at least 6 months. There are 115 (please note that loans financed in November and December 2018 are not included as they still don’t have 6 months of life at the time of writing).
Among these 115, 1 reached at least 30 days delay in his first 6 months, which accounts for 0.9%.
Better than S1 2017 but let’s be careful with the conclusions as numbers are small...
And now at the R3-12…
We look at loans having reached more than 60 days delay (equivalent to 3 installments in delay) in the first 12 months of their life, among all loans from a vintage which had at least 12 months of life.
This is giving more time to observe payments problems, but the drawback is that we skip more recent loans as we compare only the ones with at least 1 year history.
| Period | Financed* | Incidents | R3-12 % |
|---|---|---|---|
| 2016 S2 | 77 | 3 | 3.9% |
| 2017 S1 | 168 | 6 | 3.6% |
| 2017 S2 | 173 | 9 | 5.2% |
| 2018 S1 | 102 | 3 | 2.9% |
| ALL | 520 | 21 | 4.0% |
The numbers are rather close, the first semester of 2018 being of better quality although the numbers are a bit small to ensure strong statistical significance.
P.S.
These KPI cannot be easily compared to the existing indicator on the dashboard or on the statistics page.
The dashboard indicator refers to a current situation on the portfolio of loans while the KPIs R2-6 and R3-12 look at what happened in the past on various vintages of production observed over a similar window.
 Results after 1 year of investing with Klear
 Results after 2 years of investing with Klear
 How is P2P lending taxed with Klear?
 Is P2P lending providing better conditions than banks?