


It’s time to make an update on the performance of the portfolio as we just proceeded with our third batch of debt purchase.
6 loans with 120+ days delay and no hope for amicable collection were purchased at a discount by Klear to the investors.
The collection agencies we contacted whether declined the proposal because of the small number of loans, whether proposed a price well below the expectations.
Therefore, Klear decided, like during the previous debt sale, to purchase these loans at the same price as last time, i.e. at 34.7%.
The total outstanding of these 6 loans was 24 787.49 BGN and they were purchased at 8 601.26 BGN.
Since the beginning of the platform, 14 defaulted loans have been purchased, on a total of 1 170 financed loans.
In the following chapters, we update the main indicators regularly followed.
1. Average return on the whole portfolio
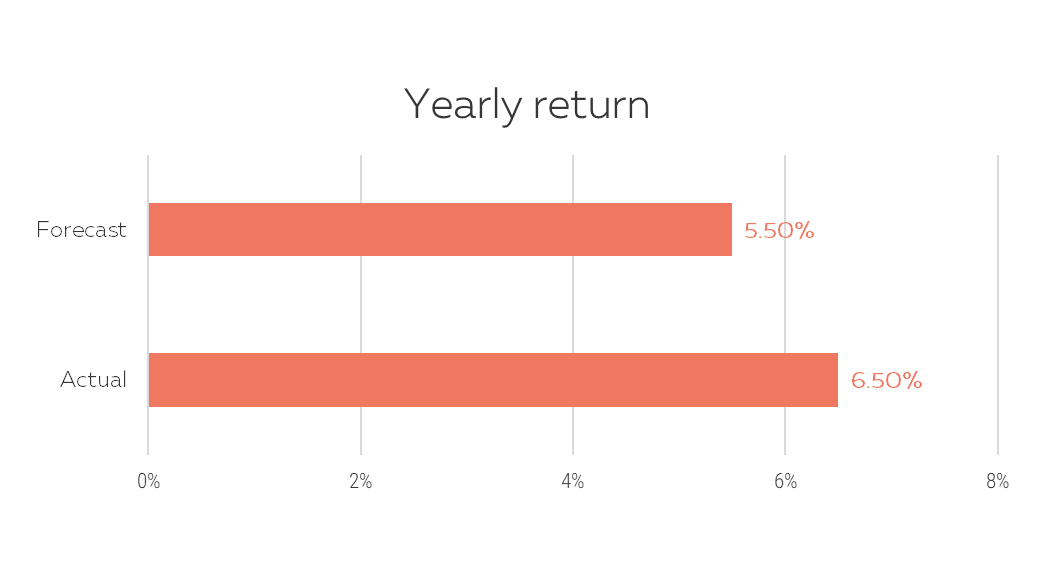
The annualized return is on average 6.5%, well above the forecast. The quality of the loan portfolio remains high.
2. Net profit
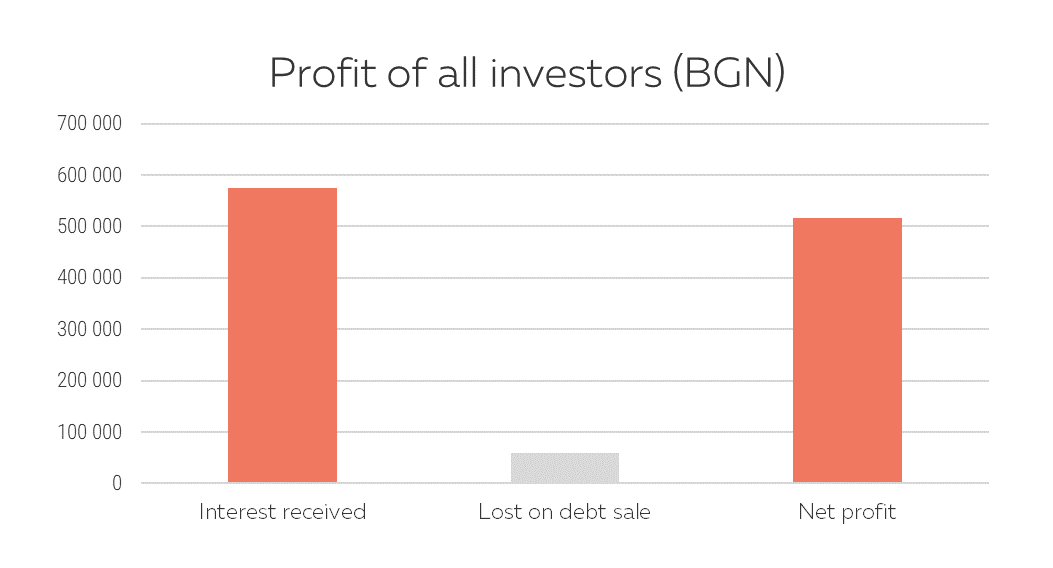
Only a small fraction of the interest received is taken to cover the losses from the bad loans. The model is well balanced.
3. Investors by level of return
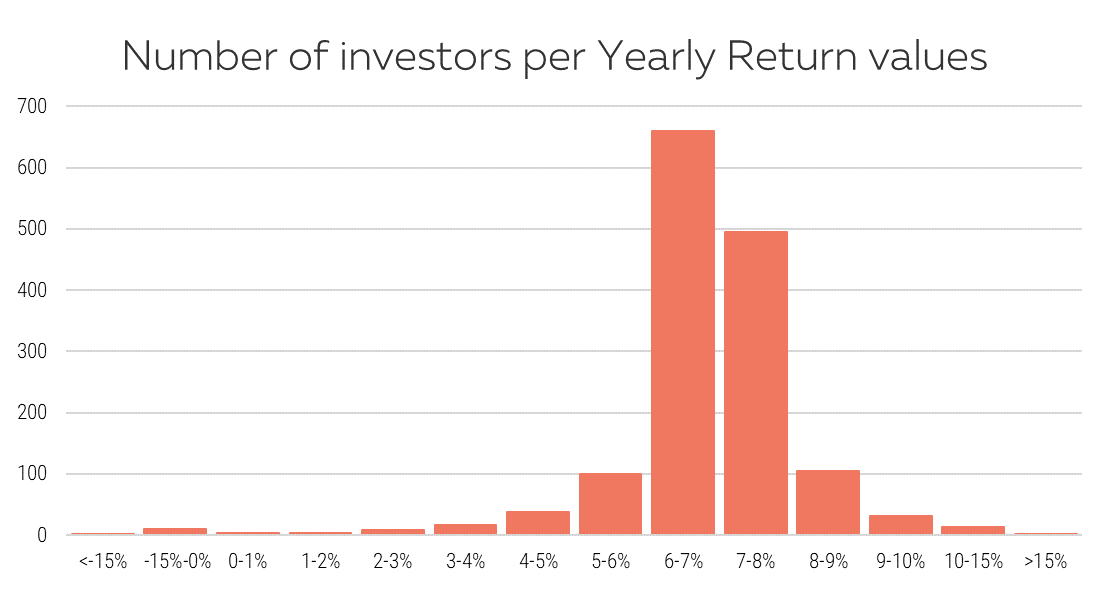
Most of our investors earn between 6% and 8%.
4. Return vs number of loans invested in (for investors not active on the secondary market)
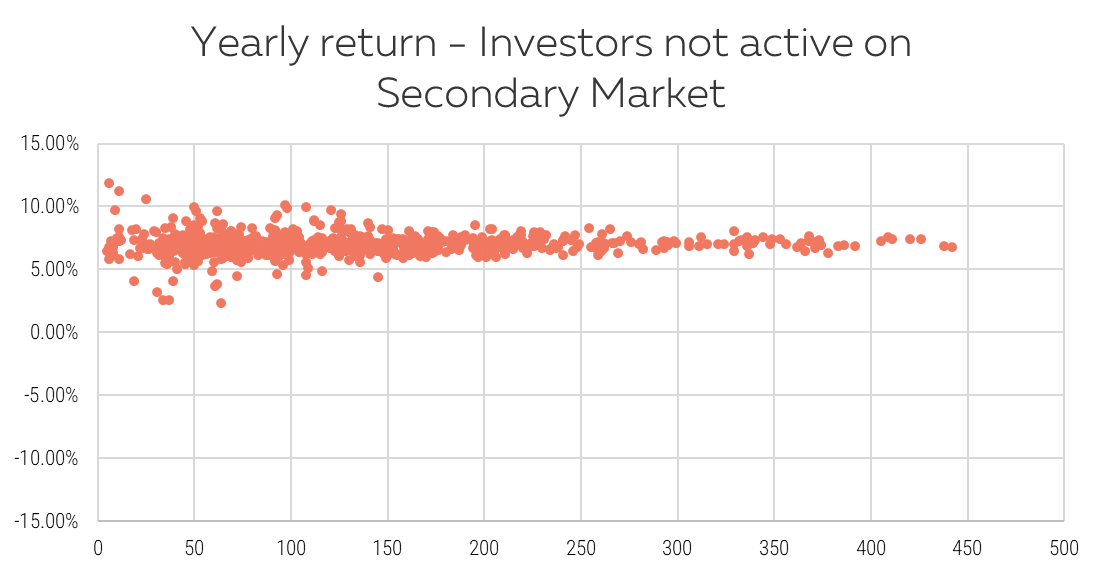
All the investors with more than 150 loans (the safe threshold) have a return above 5%.
5. Return vs number of loans invested in (for investors active on the secondary market)
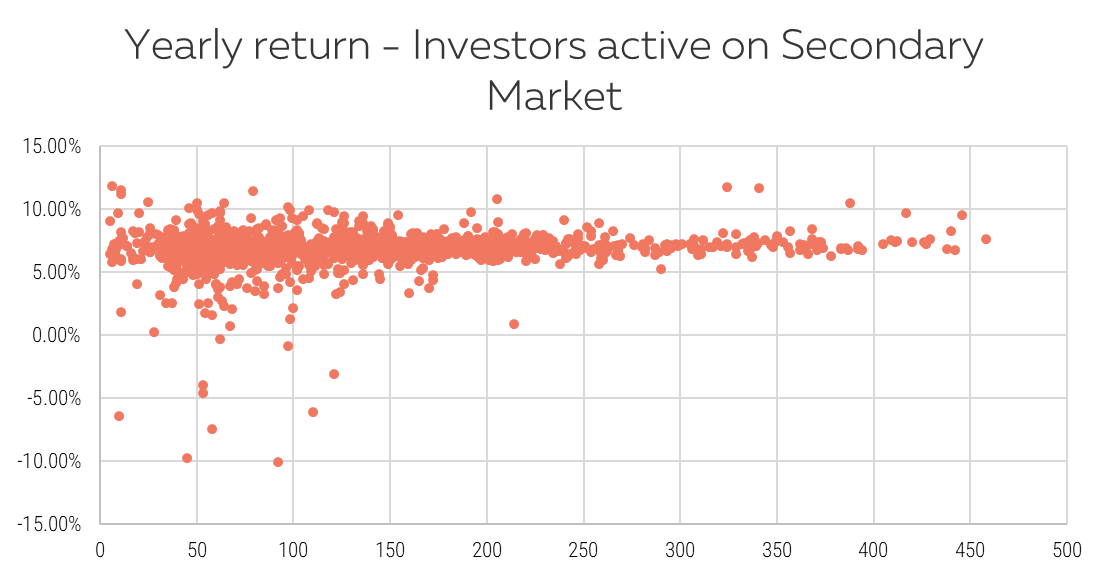
Transacting on the secondary market offers opportunities to earn above 10% but it is riskier.
6. Time to sell
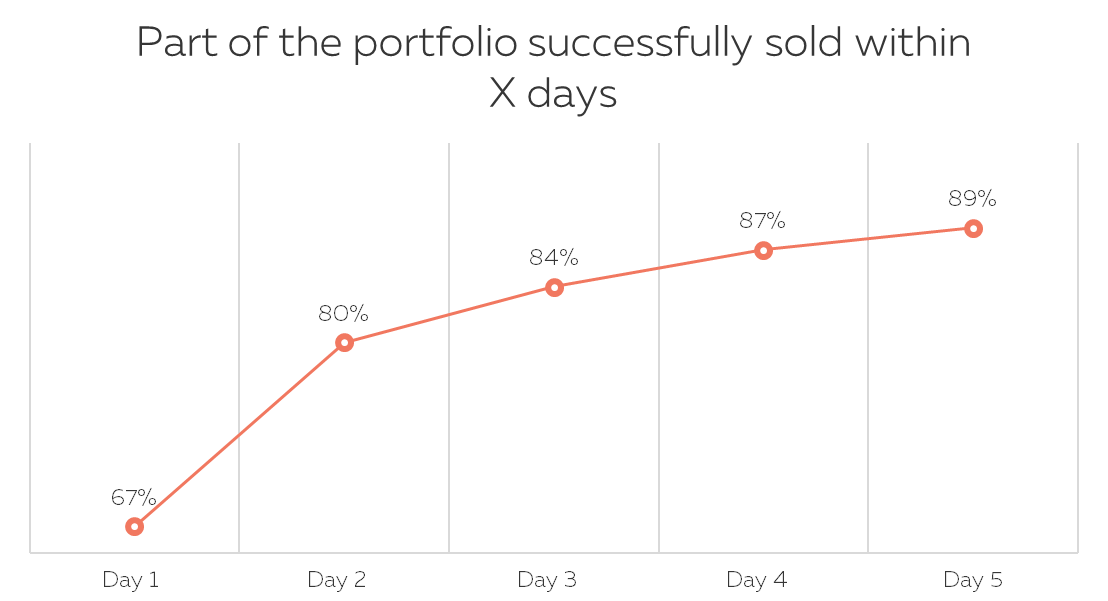
This indicator remains at the same levels compared to the previous analysis from April 2019.
7. Risk levels by vintage of production
Short term indicator R2-6
It’s a short-term indicator to assess at an early stage the quality of a new vintage.
We look at loans financed having reached more than 30 days delay in the first 6 months of their life (among all loans from a vintage which had at least 6 months of life)*.
| Period | Financed* | Incidents | R2-6 % |
|---|---|---|---|
| 2016 S2 | 77 | 3 | 3.9% |
| 2017 S1 | 168 | 3 | 1.8% |
| 2017 S2 | 173 | 4 | 2.3% |
| 2018 S1 | 183 | 0 | 0.0% |
| 2018 S2 | 115 | 1 | 0.9% |
| 2019 S1 | 133 | 3 | 2.3% |
| ALL | 922 | 14 | 1.5% |
According to this early risk indicator, the quality of the loans originated in the first semester this year is like the production from 2017. The figure of 2.3% is higher than the exceptionally low values of 2018 but it remains at an acceptable level.
How to read it:
For example, among all the loans financed in the first semester of 2019, 133 had at least 6 months of history and among them 3 reached at least 30 days delay (equivalent to 2 installments in delay), which is 2.3%. Please note that among these 3, some may probably have repaid their delay (actually 2 of the 3 are without delay at the time this article is written).
1 Year risk indicator R3-12
We look at loans having reached more than 60 days delay (equivalent to 3 installments in delay) in the first 12 months of their life, among all loans from a vintage which had at least 12 months
| Period | Financed* | Incidents | R3-12 % |
|---|---|---|---|
| 2016 S2 | 77 | 3 | 3.9% |
| 2017 S1 | 168 | 6 | 3.6% |
| 2017 S2 | 173 | 9 | 5.2% |
| 2018 S1 | 183 | 3 | 1.6% |
| 2018 S2 | 125 | 2 | 1.6% |
| ALL | 726 | 23 | 3.2% |
It confirms the previous analysis that loans originated in 2018 are with better quality than the ones in 2017.
It’s yet too early to observe the 2019 vintage as none reached 1-year history of payment.
Conclusion
The number of incidents is very low in absolute value and as a percentage of the financed loans. Nothing to worry of.
The variability of the calculated indicators comes from small numbers rather than evolutions in the quality of the new business.
 We performed our second debt sale
 Overview of the Loan Portfolio - April 2019