


Last updated on
Let's start with a question: Do you have an investment, which:
- Has a floating return rate?
- Has an irregular Investment interval or amount?
- Your withdrawals are also irregular in terms of amount and time?
If you have at least one answer "Yes", and you don't know how to measure your returns, then this article is for you. I will explain how to calculate the return on an investment where nothing is regular - like for example stocks, gold or peer-2-peer lending investments - using a simple Excel formula.
As you probably guessed by the title of the article, the magic Excel formula is XIRR. Here is what Microsoft Office documentation says about it: "Returns the internal rate of return for a schedule of cash flows that is not necessarily periodic." As an input, the formula receives two lists: one with the dates and another with the corresponding amounts. The same functionality exists in other popular spreadsheets as well - Google Docs, Open Office.
If you are familiar with XIRR and the problems it solves, feel free to skip to the second part of the article. There I will present a C# module which implements the same formula (source code is on Github).
Financial overview
First, we will explore the simplest possible example. Imagine you have a fixed term deposit with a fixed interest rate of 1% per year. If you invest $1000 you will receive $1010 after one year. Here the intuitive answer is that the return is 1% and it is correct. If we put these numbers in Excel, we will receive the same result. Note that when you invest the sign of the amount is negative.
| Date | Amount |
|---|---|
| 01/01/2017 | -1000 |
| 01/01/2018 | 1010 |
| Return | 1.0000% |
What will happen though, if we add some complexity to the deposit example and after 6 months we withdraw half of the amount (assuming the bank will not charge us anything for breaking the contract)? In this case, we will receive the 1% interest for the entire amount for 6 months (0.5 years) i.e.
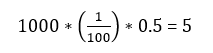
and 1% interest for 5000 (half of the amount) for 6 months (0.5 years) i.e.
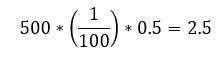
or to wrap it up
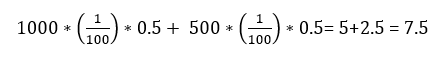
When we enter the values in Excel, we see that the result is almost the same, but there is a small difference after the 5th decimal.
| Date | Amount |
|---|---|
| 01/01/2017 | -1000 |
| 01/07/2017 | 500 |
| 01/01/2018 | 507.5 |
| Return | 1.0019% |
I'm not going to bother you with the intricacies of different interest calculation bases (360/365 days per year, 30 days per month/real number of days) which is another reason for the discrepancy in the latter example. With it, I just want to point out that even the simple irregularity impacts the return.
Now let's move to something more real. Imagine that you invest in shares of some company. Let's assume that at the beginning of every month you buy shares for 500 for one year (for 12 months you invest 6000). The Shares' price change is shown in the following table.
| Date | Price per share |
|---|---|
| 01/01/2017 | 68 |
| 01/02/2017 | 69 |
| 01/03/2017 | 70 |
| 01/04/2017 | 71 |
| 01/05/2017 | 72 |
| 01/06/2017 | 73 |
| 01/07/2017 | 74 |
| 01/08/2017 | 75 |
| 01/09/2017 | 76 |
| 01/10/2017 | 77 |
| 01/11/2017 | 78 |
| 01/12/2017 | 79 |
| 01/01/2018 | 80 |
The shares you buy with your investments are shown below.
| Date | Price per share | Investment | Shares |
|---|---|---|---|
| 01/01/2017 | 68 | 500 | 7.352941 |
| 01/02/2017 | 69 | 500 | 7.246377 |
| 01/03/2017 | 70 | 500 | 7.142857 |
| 01/04/2017 | 71 | 500 | 7.042254 |
| 01/05/2017 | 72 | 500 | 6.944444 |
| 01/06/2017 | 73 | 500 | 6.849315 |
| 01/07/2017 | 74 | 500 | 6.756757 |
| 01/08/2017 | 75 | 500 | 6.666667 |
| 01/09/2017 | 76 | 500 | 6.578947 |
| 01/10/2017 | 77 | 500 | 6.493506 |
| 01/11/2017 | 78 | 500 | 6.410256 |
| 01/12/2017 | 79 | 500 | 6.329114 |
| Total shares | 81.81344 | ||
Which means that after one year of investment (1.1.2018) you own 81.81344 shares with a price of 80 each. So, if you sell them you will get:
81.81344 * 80 = 6545.08
At the end of the investment, you have an amount which is 9.08 % bigger than the invested. But is this the real return? Of course not. Because not all the amount was invested for the whole period. Again, the way to calculate the return is XIRR.
| Date | Amount |
|---|---|
| 01/01/2017 | -500 |
| 01/02/2017 | -500 |
| 01/03/2017 | -500 |
| 01/04/2017 | -500 |
| 01/05/2017 | -500 |
| 01/06/2017 | -500 |
| 01/07/2017 | -500 |
| 01/08/2017 | -500 |
| 01/09/2017 | -500 |
| 01/10/2017 | -500 |
| 01/11/2017 | -500 |
| 01/12/2017 | -500 |
| 01/01/2018 | 6545.08 |
| Return | 17.1156% |
And the real return is 17.12 %. Much better, isn't it.
If you sell some shares somewhere in the year, you just must add a row in the table above with the exact date and the amount (with a positive sign). And that's it.
As a conclusion, if you have an investment with irregular cash flows, XIRR is your best friend. Using it, you can compare the profitability of every investment and then react accordingly.
How to calculate XIRR by ourselves?
You may wonder why would someone want to replicate Excel functionality? And the answer is simple – if you develop a software, which is supposed to calculate XIRR, you don’t have other option. You can’t just embed Excel in your application. To be honest, there is no technical limitation to do it, but you have to pay the price. And the price is not only financial. Excel is not multithreading friendly – so if you plan to do some calculations with it on a Web Server you may face serious performance issues.
Back to the topic, to calculate XIRR, you have to do one thing - solve this equation:
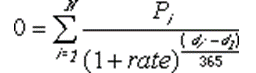
where:
- di = the ith, or last, payment date.
- d1 = the 0th payment date.
- Pi = the ith, or last, payment.
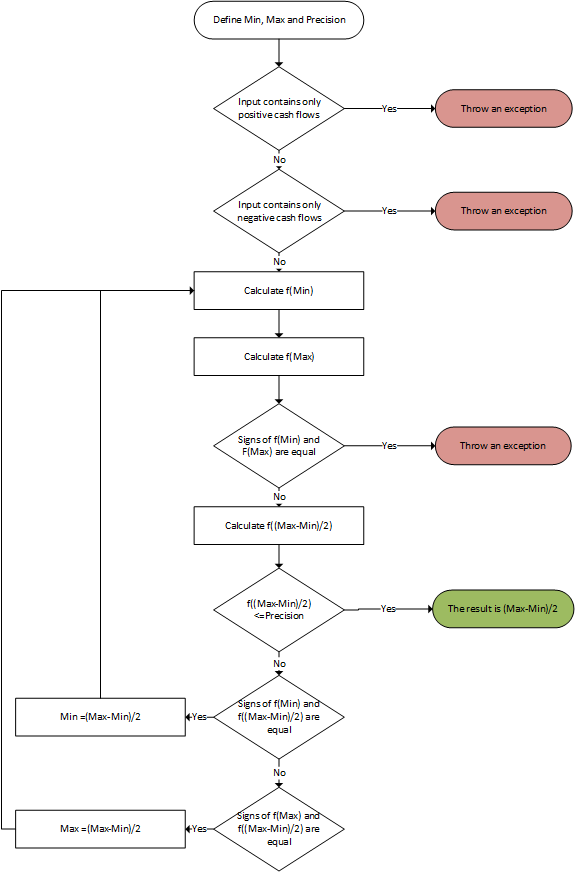
There are many algorithms to solve such kind of equations, but I will explain the one, whose results are most like Excel’s. It is called Bisection Method. The idea is simple. We start with the minimum and maximum possible values, and the precision we want. You can’t lose more than 100% of your investment, so the min value is -100%. There is a small technical detail – The equation above could not be solved if the rate is -1 (-100%), therefore the min value should be slightly bigger. The max value is defined according to the business case – unless you invest in some Ponzi scheme, the return could not exceed 100%, but to be on the safe side, you can start with 1000% as a maximum value.
First you must check if there are both positive and negative cash flows. Having no positive cash flows means that the lost is 100% - investment without any return – which is the border case of rate = -1. On the other side, having only positive cash flows means infinitive return – you receive something without investing in. Then the steps are:
- You solve the equation above for the min and max value. If the signs of the results are different, there is a solution which is between them.
- Then you calculate the equation with a value which is the average of min and max – let call it V1.
- If the sigh of the result is equal to the min value, you replace it with the V1. If the sign of V1 is equal to the max amount, it becomes the new max amount.
- If the difference between new min and max value is smaller or equal to the precision needed, the result is their average. If not, start with step 1, using the new min and max values.
As the saying goes, one picture is worth a thousand words. In the next picture you can see the same algorithm described as block scheme.
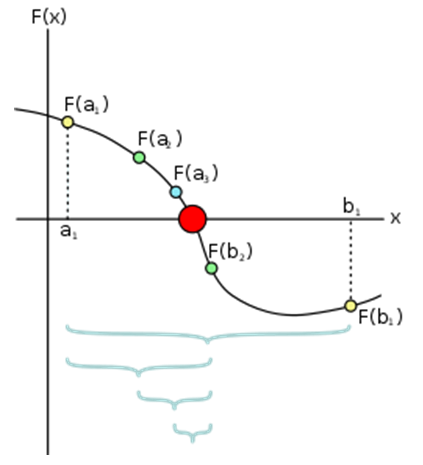
In the picture below, you can see visually how the method works.
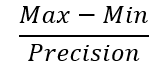
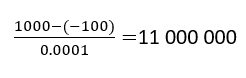
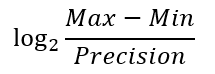
If you don’t use Bisection method, you can just iterate from min to max value, incrementing the min value with the precision and observe when the sign will change. As you can expect, this approach may result in a big number of loops, or to be more precise, in worst case scenario it will be:
Which, if you want a precision of 0.0001 results of
Quite a lot, obviously. With Bisection method you decrease the maximum number of loops to the binary logarithm of the above result:
Or in numbers
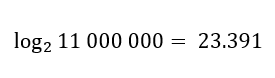
Much better, isn't it.
And now the C# implementation
Our final goal is to create a method, which receives cashflows and optionally precision and max possible rate and returns calculated XIRR if possible. Here is its signature.
public static double XIRR(List<CashFlowDates> cashflows, int decimals = 4, double maxRate = 1000000)
The type CashFlowDates is a simple data carrier:
public double Amount { get; set; }

public DateTime Date { get; set; }
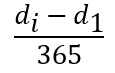
To speed the process, this type is recalculated internally to CashFlowFractionOfYear, which instead of DateTime, stores it as a coefficient calculated as time distance between the first cash flow item in the list and the date in the item itself in years. In fact, it does the following calculation from the XIRR formula above:
And the structure is:
public double Amount { get; set; }

public double Years { get; set; }
The method that converts CashFlowDates to CashFlowFractionOfYear is this:
 private static List<CashFlowFractionOfYear> ToFractionOfYears(List<CashFlowDates> cashflows)

        {

            var firstDate = cashflows.Min(x => x.Date);

            return cashflows

                .Select(x => new CashFlowFractionOfYear(x.Amount, ((double)x.Date.Subtract(firstDate).Days) / 365))

                .ToList();

        }
Then there is a method which calculates the equation that should be solved for a given rate.
private double CalcEquation(List<CashFlowFractionOfYear> cashflows, double interestRate)

        {

            return cashflows.Select(x => (x.Amount / (Math.Pow((1 + interestRate), x.Years)))).Sum(x => x);

        }
The root of the equation is then found using recursion:
public double Calculate(double precision, int decimals)

        {

            if (Math.Sign(LowResult) == Math.Sign(HighResult))

            {

                throw new Exception("Value cannot be calculated");

            }


            var middleRate = (LowRate + HighRate) / 2;

            var middleResult = CalcEquation(CashFlow, middleRate);

            if (Math.Sign(middleResult) == Math.Sign(LowResult))

            {

                LowRate = middleRate;

                LowResult = middleResult;

            }

            else

            {

                HighRate = middleRate;

                HighResult = middleResult;

            }

            if (Math.Abs(middleResult) > precision)

            {

                return Calculate(precision, decimals);

            }

            else

            {

                return Math.Round((HighRate + LowRate) / 2, decimals);

            }


        }
Now, when we have all the ingredient, we can assemble everything in a single function:
        public static double XIRR(List<CashFlowDates> cashflows, int decimals = 4, double maxRate = 1000000)

        {

            if (cashflows.Where(x=> x.Amount > 0).Count() == 0)

            {

                throw new IncosistentCashFlowException();

            }

            if (cashflows.Where(x => x.Amount < 0).Count() == 0)

            {

                throw new IncosistentCashFlowException();

            }


            var precision = Math.Pow(10, -decimals);

            var minRate = -(1 - precision);

            return (new XIRRCalculator(minRate, maxRate, cashflows).Calculate(precision, decimals));

        }
Here we assume that precision is a function of decimals – if you want 4 decimals, then the precision is 0.0001. There are guarding condition, to prevent calculations if all the cashflows are with one and the same sign. Please note again, that the initial min value is not exactly -1 – and the reason is very simple – if you substitute Rate with -1 in the XIRR equation, there will be division by zero error.
In the source code you can find unit tests, covering the cases described in the first part.
Here is the moment to put a disclaimer – there are some small difference in the results, compared to Excel – usually after the 6th decimal.
As I said earlier, the source code of the entire solution can be found on GitHub under MIT License. Feel free to use and improve it.
 TOP 10 Everything about Peer to Peer Lending
 Results after 1 year of investing with Klear
 Results after 2 years of investing with Klear